
An EC2 instance can show 2/2 status checks passed while the application on it has been dead for twenty minutes. The hypervisor is fine, the kernel booted, the network stack answers pings — none of which tells you whether nginx stopped accepting connections or your app is stuck returning 500s to every request. That gap, between “the instance is up” and “the thing running on it actually works,” is what application status checks now cover natively, as of August 10.

The Gap It Fills
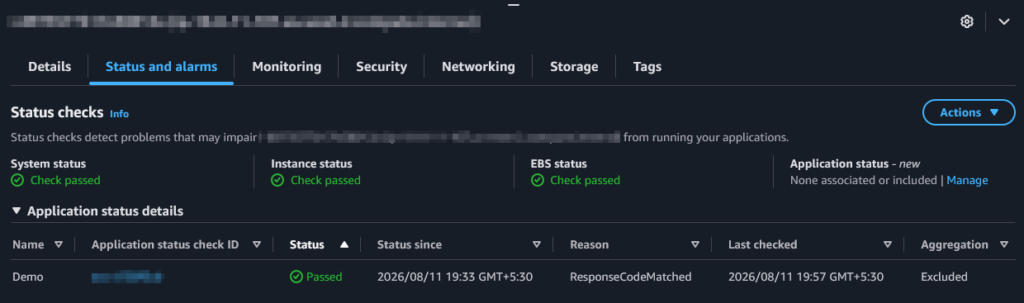
EC2 has run two automatic checks on every instance for years: a system status check watching the AWS hardware underneath, and an instance status check watching the guest OS and its network config. An attached EBS check came later for volume reachability. All three are automatic — you can’t turn them off or point them anywhere — and none of them look inside the application. A crashed worker process or a web server that stopped listening is invisible to EC2, because the instance itself still looks perfectly healthy.
Closing that gap used to mean building it yourself: an ALB target group health check if you had a load balancer, a cron job and a custom CloudWatch metric if you didn’t. Application status checks are AWS’s native answer to the second case, a fourth, opt-in check that speaks HTTP directly to your application.
How It Works
You define a check with a protocol (HTTP or HTTPS), a port, a path, and a status code matcher — the same shape as an ALB health check. Associate it with instances by ID or by tag, including aws:autoscaling:groupName to cover an entire Auto Scaling group in one call, and EC2 pings that port and path every 60 seconds. Fixed interval, no faster, no slower.
aws ec2 create-application-status-check \
    --protocol https --port 443 --path "/health" \
    --status-code-matcher "200"
Two consecutive failures flip the check to impaired, two successes flip it back to ok, both configurable, along with a 6-second timeout and a 300-second grace period after launch so a slow-starting app doesn’t get replaced before it’s ready. Set that grace period too low and Auto Scaling will happily replace instances that just needed more time to boot. Full parameter reference is in the Amazon EC2 User Guide.
Where the Checks Actually Run
Worth knowing before you roll this out: check traffic doesn’t come from some anonymous AWS endpoint. AWS provisions a managed network interface inside your own VPC, one per subnet-and-security-group combination, and traffic runs from within your VPC over AWS’s internal network, never the public internet. That managed ENI doesn’t count against your instance’s ENI limit, but it does count against your account’s ENIs-per-VPC quota, worth checking before a fleet-wide rollout across a lot of subnet-and-security-group combinations.


The step people miss: CloudWatch gets a metric per check plus one aggregate per instance, and it’s only the aggregate that Auto Scaling watches. You can also specify the source subnet and security group yourself instead of letting AWS choose, useful if your network has segmentation rules a security review would care about.

Auto Scaling, and the Deploy Trap
Auto Scaling groups already pull health signals from EC2, ELB, VPC Lattice, EBS, and custom checks. Application status checks slot in as one more. Associate the check with the group’s instances, and Auto Scaling replaces anything reporting impaired — no extra configuration needed. This earns its keep most on workloads that never sat behind a load balancer at all: backend workers, queue consumers, anything that never had a native AWS health signal before.
The catch: a deployment or restart makes the check fail too, since the app genuinely isn’t answering for a few seconds. Auto Scaling can’t tell “expected restart” from “actual crash,” so an unplanned deploy across a fleet can trigger a replacement storm you caused yourself. AWS gives you three ways to prevent that:
| Approach | When to use it |
|---|---|
| Suppress the check | A known, bounded maintenance window |
| Exclude from aggregation | Validating a new check without risking replacements |
| Disassociate | Permanent removal |
For routine deploys, automate suppression from your pipeline’s pre- and post-deploy hooks:
aws ec2 enable-application-status-check-suppression \
    --instance-ids i-0123456789abcdef0 --duration-seconds 3600
Put this in the deployment runbook before you need it, not after Auto Scaling has replaced half a fleet mid-release.
Two Gotchas Worth Knowing
When a check fails, look at the reason code before touching application logs. Redirects are a common false failure: health checks don’t follow 301s or 302s, so a /health path that redirects will fail unless you add that code to your matcher. Two other behaviors catch people off guard. The health check goes out over HTTP/2, so a minimal server that only speaks HTTP/1.1 in cleartext can fail a check that a plain curl would pass. And the HTTPS check never validates the server’s certificate, so a passing check tells you nothing about certificate validity.
What It Costs
Pricing: $0.01 per hour per managed ENI, per Availability Zone, plus standard CloudWatch pricing for the metrics. That cost tracks unique subnet-and-security-group combinations, not instance count. One Auto Scaling group in one subnet is one ENI per AZ, essentially free. A fleet spread across many subnets for segmentation reasons will rack up more ENIs than the instance count suggests, so it’s worth estimating that number before assuming this costs nothing. Default account quotas (50 checks, 5,000 targets) are generous for most teams and adjust automatically except for the targets limit, which needs a manual request.
Where This Fits
Application status checks aren’t a replacement for real observability. There’s no tracing, no latency data, just “did this path return the code I said meant healthy.” What they replace is whatever duct tape your team already built to answer that one question: a cron job and a custom metric, a sidecar pinging itself, a script from years ago nobody wants to touch. If that’s your current setup, especially for anything that doesn’t sit behind a load balancer, it’s worth an afternoon to pilot this with the check set to excluded before it can page anyone.