
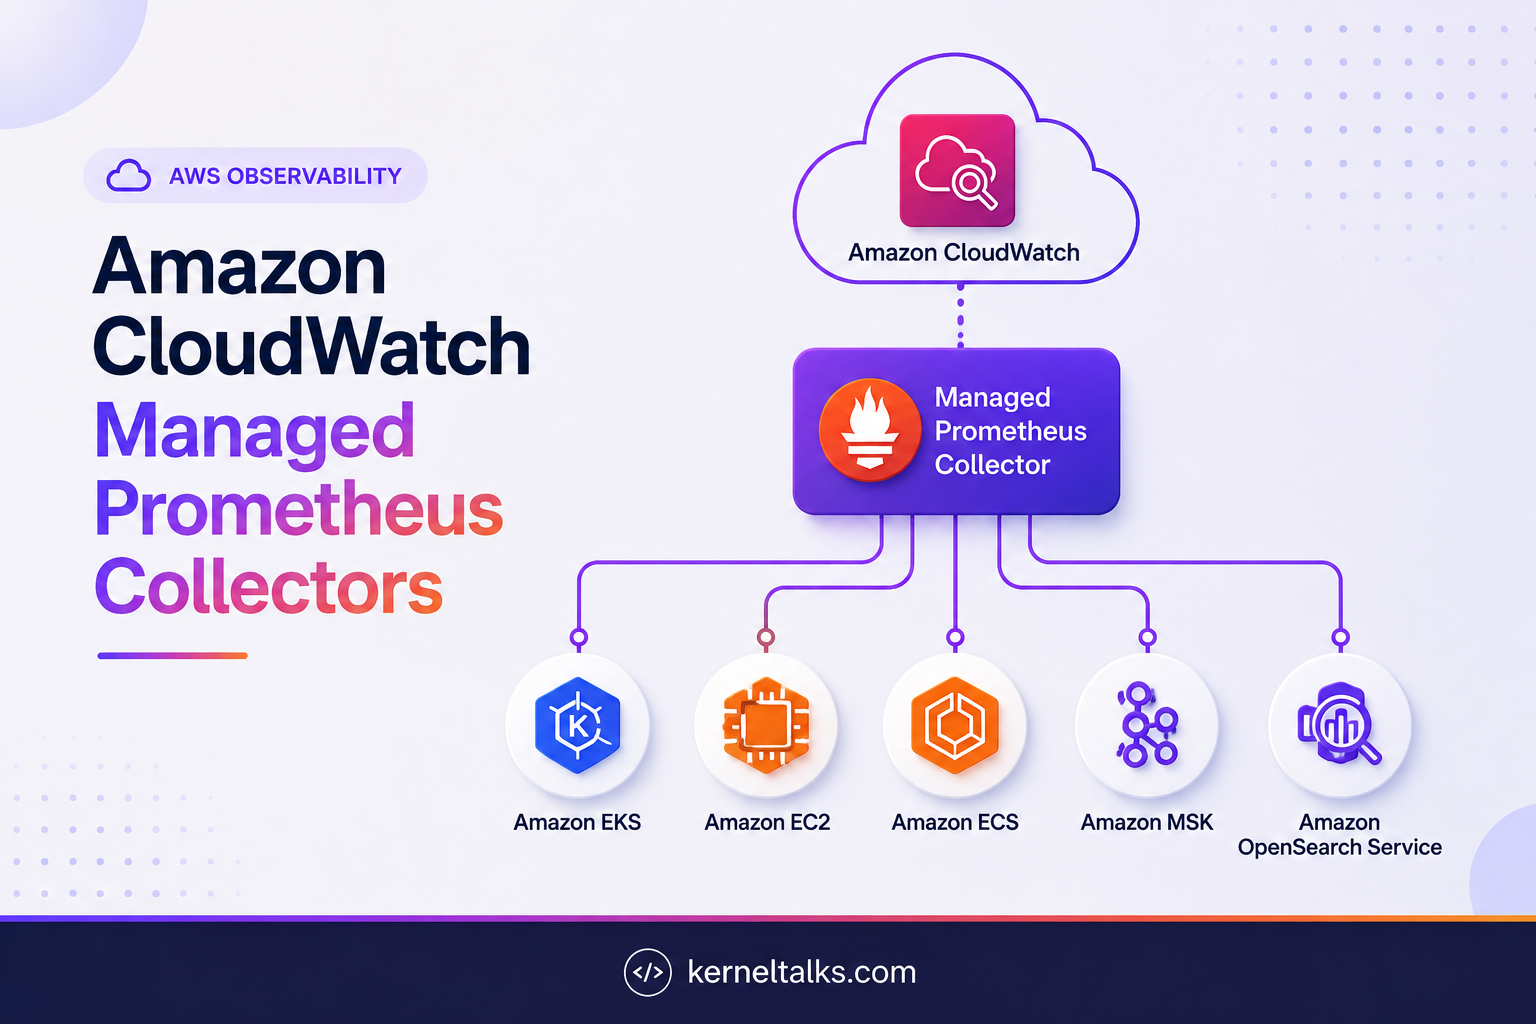
Ask anyone who has wired Prometheus metrics into CloudWatch what the real bottleneck was, and it was never Prometheus. It was the collector. You’d stand up an OpenTelemetry Collector as a Deployment or a DaemonSet, hand-tune its scrape config, guess at memory limits for cardinality you hadn’t measured yet, and then spend the next year treating it like one more piece of cluster infrastructure that needed patching, right-sizing, and on-call attention of its own.

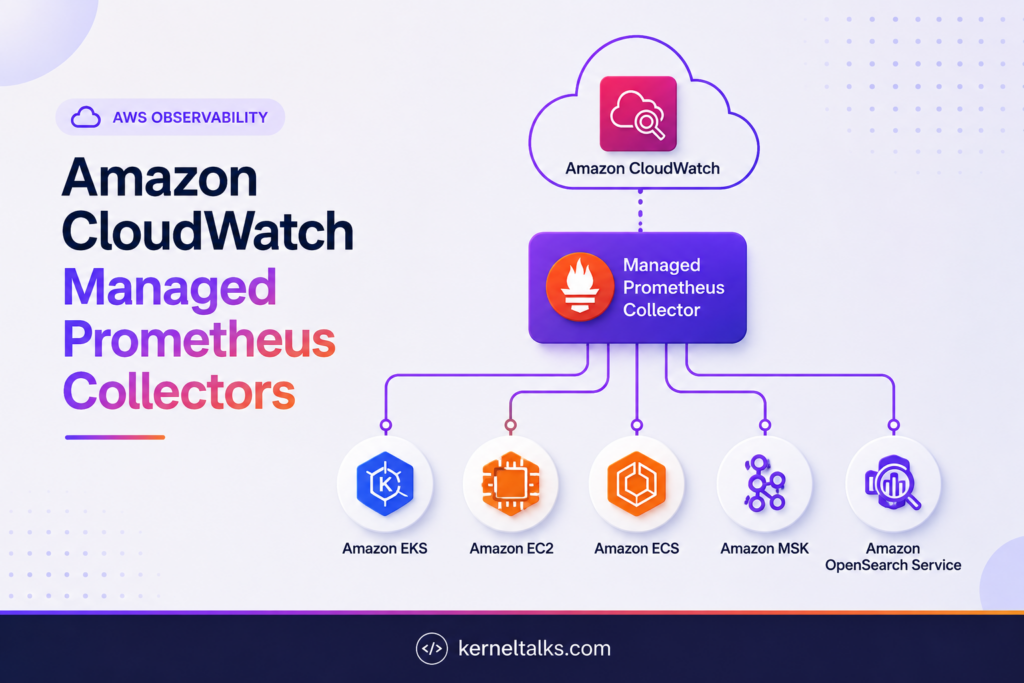
On July 31, AWS announced managed Prometheus collectors for Amazon CloudWatch, a fully managed, agentless scraper for Amazon EKS, Amazon EC2, Amazon ECS, Amazon MSK, and Amazon OpenSearch Service. You supply a scrape configuration and a way to reach your resources, and CloudWatch takes it from there: provisioning the collector, scaling it, and keeping it running. What it scrapes arrives in OpenTelemetry format, queryable with PromQL right next to your AWS vended metrics.
That’s the announcement. The more useful question, if you’ve spent any time in AWS’s observability stack already, is what’s actually new here versus what’s just wearing a new badge.
The new part is the destination, not the collector
This isn’t new collector technology. AWS shipped this same agentless scraper (automatic target discovery, no in-cluster agent, multi-AZ, metrics that never leave your VPC) as the Amazon Managed Service for Prometheus collector back in November 2023, initially scoped to EKS and writing into an AMP workspace. That lineage is visible directly in the API today: you still create one of these with the CreateScraper operation, under the aws amp CLI namespace, not some new CloudWatch-specific command. What’s new in this announcement is the destination and the source list. Alongside an AMP workspace, the same managed collector can now write into a CloudWatch dataset, and the supported sources have grown from EKS-only to include EC2, ECS, MSK, and OpenSearch.
Here’s an EKS scraper creation, adapted from AWS’s setup docs:
aws amp create-scraper \
  --alias "eks-metrics-scraper" \
  --source eksConfiguration="{clusterArn='arn:aws:eks:us-west-2:111122223333:cluster/prod-cluster', \
    securityGroupIds=['sg-0123456789abcdef0'], \
    subnetIds=['subnet-0aaa111','subnet-0bbb222']}" \
  --scrape-configuration configurationBlob=$(cat eks-scrape-config.yaml | base64 -w 0) \
  --destination cloudWatchConfiguration="{datasetArn='arn:aws:cloudwatch:us-west-2:111122223333:dataset/default'}"
Swap that final --destination flag for an ampConfiguration with a workspace ARN and you’re back to the exact collector AWS shipped in 2023. If you’re already running AMP collectors for Grafana dashboards, that’s the useful takeaway: this is an incremental destination option on infrastructure you may already trust, not a new product to evaluate from a cold start.
It also builds on something CloudWatch shipped only six weeks earlier: native OTLP ingestion with PromQL querying, launched June 9. That release is what made CloudWatch a legitimate destination for Prometheus-shaped metrics at all, with per-GB pricing and curated Container Insights dashboards for EKS. Managed Prometheus collectors are the agentless front door to that same pipeline, extended past what Container Insights auto-instruments.
How a scrape actually reaches CloudWatch
The mechanics will feel familiar if you’ve used any managed AWS scraper before. You hand the collector a set of subnets, and it creates an Elastic Network Interface in each one. It scrapes your targets over those ENIs using OTLP, then delivers the result to your CloudWatch dataset through a VPC endpoint. Nothing crosses the public internet.

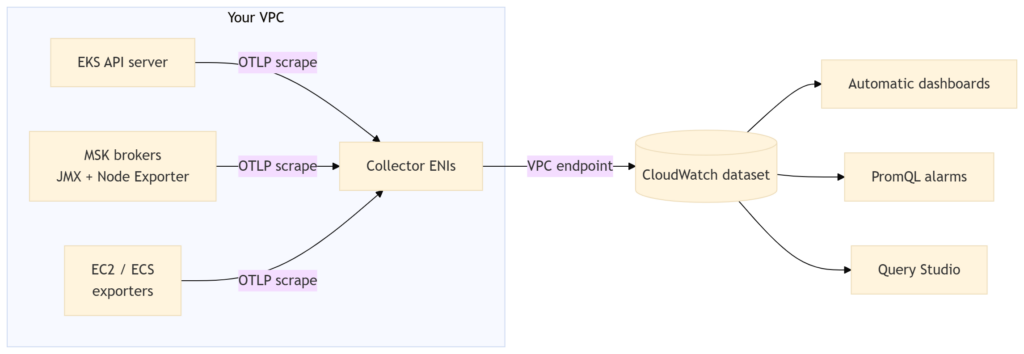
What isn’t obvious from the diagram is that target discovery differs meaningfully by source, and that’s what determines how much of an existing scrape config actually survives the move:
- EKS uses Kubernetes service discovery against the cluster API, plus control-plane metrics (kube-scheduler and kube-controller-manager, exposed starting at Kubernetes 1.28).
- ECS uses DNS-based discovery through AWS Cloud Map, so tasks register once and get picked up without a static IP list.
- EC2 is
static_configsagainst private IPs, no different from pointing a self-managed setup at a fixed target list. - MSK uses DNS-based discovery against the cluster’s own bootstrap DNS name, which resolves to every broker and survives broker replacement without reconfiguration.
MSK is worth a closer look because it needs a prerequisite step: enabling Open Monitoring on the cluster, which exposes a JMX Exporter on port 11001 and a Node Exporter on port 11002. A scrape config covering both looks like this:
global:
  scrape_interval: 60s
  external_labels:
    cluster_name: my-msk-cluster

scrape_configs:
  - job_name: 'msk-jmx'
    dns_sd_configs:
      - names: ['my-cluster.abc123.c4.kafka.us-west-2.amazonaws.com']
        type: A
        port: 11001
    relabel_configs:
      - source_labels: [__address__]
        target_label: instance

  - job_name: 'msk-node'
    dns_sd_configs:
      - names: ['my-cluster.abc123.c4.kafka.us-west-2.amazonaws.com']
        type: A
        port: 11002
    relabel_configs:
      - source_labels: [__address__]
        target_label: instance
That gets you broker-level Kafka metrics (topic throughput, consumer lag, under-replicated partitions) from the JMX exporter, and host-level CPU, memory, and disk metrics from Node Exporter, both queryable with PromQL once they land. Two things to check before you plan around this: MSK Serverless and MSK Express aren’t supported, and public access combined with KRaft metadata mode is excluded too.
The scrape config is Prometheus-compatible, not Prometheus
This is worth reading closely before you migrate anything, because “Prometheus-compatible YAML” undersells how much is actually missing. The supported configuration surface covers global settings, scrape_configs with static_configs and dns_sd_configs, and relabeling. What isn’t there matters more than what is:
- Minimum scrape interval is 30 seconds. An SLO built on 10 or 15-second scrapes doesn’t fit here.
- No
file_sd_configs, and no Consul, Eureka, or other external service discovery. If your target list comes from anywhere other than Kubernetes, Cloud Map, a static list, or MSK’s broker DNS, this collector can’t reach it. remote_writeandremote_readdon’t apply, because delivering to CloudWatch is the whole job. A fan-out to a second backend doesn’t carry over.- Configuration blobs cap out at 256 KB, base64-encoded.
None of this is really a flaw. It’s the standard trade-off of a managed service. AWS narrowed the surface to what it can operate reliably at scale, and the narrowing happens to remove exactly the parts of Prometheus configuration that are hardest to run safely inside someone else’s control plane. But “copy your existing prometheus.yml over” is rarely literally true. Diff your current scrape configs against this list before you commit to a cutover date, not after.
What ships automatically, and what doesn’t
EKS and MSK both get a curated dashboard the moment metrics start flowing — EKS OTel and MSK OTel in the CloudWatch console — plus attribute enrichment on every metric: account, region, an inferred unit, and for EKS specifically the cluster name and ARN. That enrichment is what makes PromQL filtering pleasant instead of an exercise in label archaeology. The EC2/ECS path doesn’t come with an automatic dashboard, which is a reasonable trade given how varied EC2/ECS metric shapes are in practice, but it’s worth knowing before cutover rather than after.
Operationally, a managed collector vends its own logs to CloudWatch Logs covering target discovery, scrape successes and failures, and configuration errors, and you manage the scraper itself with aws amp list-scrapers, describe-scraper, and delete-scraper. Deleting one tears down its ENIs, and that cleanup takes a few minutes, so don’t script an immediate re-create into the same subnet.
Cross-account guidance has shifted too. Instead of the role-chaining pattern AMP has historically used for cross-account scrapers, AWS’s current recommendation for both EKS and MSK is CloudWatch metric centralization: replicate the metrics to a monitoring account rather than granting the scraper cross-account reach in the first place.
What this actually costs
Pricing has two components that scale independently, and it’s worth keeping them separate. The collector itself is billed hourly, similar in shape to an ENI or a NAT gateway, though the specific per-hour rate isn’t broken out yet on AWS’s public pricing page as of this writing. What is confirmed is that everything the collector delivers rides on standard CloudWatch OpenTelemetry ingestion pricing: currently $0.50 per GB for general OTel metric publishing, a flat rate that bundles in fifteen months of storage with no separate per-metric or per-API charge. A typical data point with ten to fifteen attributes runs 300 to 600 bytes, for a sense of scale. Console PromQL queries (Query Studio, dashboards) are free; programmatic PromQL queries cost $0.01 per million samples scanned.
That per-GB model is a real shift in how you’d think about cost here. Classic CloudWatch metrics billed per unique metric-dimension combination, so cardinality was the thing to fear. Under OTel ingestion, cardinality by itself is free; what costs money is the serialized size of each data point, which grows with the number and length of the labels attached to it. Fifteen short labels on a metric barely move the needle regardless of series count. A handful of long, high-cardinality values move it fast: unbounded request IDs, verbose ARNs repeated on every point. If you’re porting scrape configs over from a self-managed setup, that’s the moment to prune labels you’ve been carrying out of habit rather than actual query need.
One more line item: scraping itself can rack up VPC data transfer charges between the collector and your targets, separate from CloudWatch ingestion. AWS’s own suggestion is to enable gzip on your /metrics endpoints, which cuts transfer cost without changing what actually gets ingested.
Where I’d actually reach for this
If your team is already CloudWatch-centric and has been putting off a real Prometheus setup mainly because nobody wanted to own collector infrastructure, this closes that gap cleanly. For EKS and MSK metrics specifically, it’s a solid default: alarms and dashboards in the same place as everything else, without standing up Grafana and an AMP workspace just to get there.
I’d still keep a self-managed collector, or the AMP-workspace version of this same scraper, in a handful of specific situations: sub-30-second scrape requirements, target discovery through Consul, Eureka, or file-based service discovery, or a remote_write fan-out to more than one backend because you’re mid-migration or running a deliberately multi-vendor setup on purpose. None of those are rare for a mature platform team, so this doesn’t replace the self-managed path outright. It’s a genuinely good default for the common case, which happens to be most of it.
Availability is broad but not universal — it’s live everywhere CloudWatch’s OTLP endpoint already exists, minus Asia Pacific (New Zealand) for now. Worth checking before you write the migration runbook, not after you’ve scheduled it.