

A how-to guide to save top command output in a simple text file. A useful tip to share real-time, dynamic command output in a static log file.
TOP is the first command that came to mind whenever someone asks about system resource utilization monitoring. CPU, memory utilization can be easily tracked in this tool. This tool is available to almost every UNIX and Linux flavor.
The top command outputs in a real-time updating ASCII window. Data within this ASCII GUI screen updates every 2 seconds in real-time. So all bits in it change every time and its difficult to share its output to anyone who doesn’t have access to the system. Also, if you want to collect the current output and save for future use then that’s also not possible due to updating data.
For such a situation where you want to save data being shown in the output window, top command gives you options of iterations and output files. You can define how many iterations you need and the time difference between them. It works like iterations and intervals in SAR command. Use the below options to save the output in a file.
-b: batch operation mode-n: number of iterations-d: Delay i.e. intervals between iterations (not needed for single iteration)-f file: Output file in which command saves data (supports in few versions only)
We are using a batch operation mode of the top. By defining, iterations you ask top command to stop execution after that many counts. Normally it runs continuously with a delay of 2 sec. This makes it easy to capture the output in a file using -o option. If -o is not supported then you can simply redirect output to file using redirection operator.
# top -n 1 -b >/tmp/top_output.txt
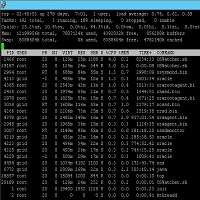
# cat /tmp/top_output.txt
top - 02:58:22 up 278 days, 7:19, 1 user, load average: 0.56, 0.52, 0.56
Tasks: 189 total, 1 running, 188 sleeping, 0 stopped, 0 zombie
Cpu(s): 10.8%us, 4.9%sy, 0.0%ni, 84.0%id, 0.2%wa, 0.0%hi, 0.0%si, 0.0%st
Mem: 12199956k total, 7774572k used, 4425384k free, 856212k buffers
Swap: 8388604k total, 0k used, 8388604k free, 4787268k cached
PID USER PR NI VIRT RES SHR S %CPU %MEM TIME+ COMMAND
2994 root RT 0 688m 84m 55m S 7.9 0.7 2998:17 osysmond.bin
4227 grid 20 0 501m 29m 17m S 2.0 0.3 458:12.36 oracle
4229 grid -2 0 500m 29m 17m S 2.0 0.3 1009:43 oracle
4251 grid 20 0 485m 27m 25m S 2.0 0.2 112:07.76 oracle
4266 root 20 0 2206m 73m 25m S 2.0 0.6 2519:45 crsd.bin
1 root 20 0 19400 1552 1228 S 0.0 0.0 0:03.23 init
2 root 20 0 0 0 0 S 0.0 0.0 0:00.41 kthreadd
3 root 20 0 0 0 0 S 0.0 0.0 56:25.42 ksoftirqd/0
----- output clipped -----
In the above example, I ran the top command with a single iteration only. Since its single iteration, I didn’t use a delay option. Also -o option was not supported so I redirected output to a file. You can see the content of the file is the top command output screen!
If you use more than 1 iteration lets say 2. Then there will 2 top output screens concatenated one after another in a log file. So it will be like you have a snapshot of all values for a given period of time for future reference. See example below:
# top -n 2 -d 4 -b >/tmp/top_out.txt
# cat /tmp/top_out.txt
top - 03:07:39 up 278 days,  7:28,  1 user,  load average: 0.43, 0.51, 0.54
Tasks: 191 total,   1 running, 190 sleeping,   0 stopped,   0 zombie
Cpu(s): 10.8%us,  4.9%sy,  0.0%ni, 84.0%id,  0.2%wa,  0.0%hi,  0.0%si,  0.0%st
Mem:  12199956k total,  7762352k used,  4437604k free,   856212k buffers
Swap:  8388604k total,        0k used,  8388604k free,  4774904k cached

  PID USER      PR  NI  VIRT  RES  SHR S %CPU %MEM    TIME+  COMMAND
 4213 grid      -2   0  485m  14m  12m S  2.0  0.1   5601:55 oracle
    1 root      20   0 19400 1552 1228 S  0.0  0.0   0:03.23 init
    2 root      20   0     0    0    0 S  0.0  0.0   0:00.41 kthreadd
    3 root      20   0     0    0    0 S  0.0  0.0  56:25.58 ksoftirqd/0
    6 root      RT   0     0    0    0 S  0.0  0.0 399995:22 migration/0
    7 root      RT   0     0    0    0 S  0.0  0.0   1:17.98 watchdog/0
    8 root      RT   0     0    0    0 S  0.0  0.0 399911:47 migration/1
   10 root      20   0     0    0    0 S  0.0  0.0  31:40.41 ksoftirqd/1
   11 root      20   0     0    0    0 S  0.0  0.0  19:42.29 kworker/0:1

----- output clipped -----

top - 03:07:44 up 278 days,  7:28,  1 user,  load average: 0.48, 0.51, 0.55
Tasks: 193 total,   4 running, 189 sleeping,   0 stopped,   0 zombie
Cpu(s): 24.5%us, 10.1%sy,  0.0%ni, 65.1%id,  0.2%wa,  0.0%hi,  0.0%si,  0.0%st
Mem:  12199956k total,  7803692k used,  4396264k free,   856212k buffers
Swap:  8388604k total,        0k used,  8388604k free,  4774968k cached

  PID USER      PR  NI  VIRT  RES  SHR S %CPU %MEM    TIME+  COMMAND
 2466 root      20   0  129m  25m 1288 S  6.6  0.2   8235:08 OSWatcher.sh
15104 root      20   0  129m  24m  344 R  1.8  0.2   0:00.09 OSWatcher.sh
 4213 grid      -2   0  485m  14m  12m S  1.4  0.1   5601:55 oracle
 2994 root      RT   0  688m  84m  55m S  1.0  0.7   2998:22 osysmond.bin
 3038 grid      RT   0 1608m 116m  53m S  0.8  1.0   2379:27 ocssd.bin
 4385 root      20   0 2543m  42m  13m S  0.8  0.4   3013:44 orarootagent.bi
----- output clipped -----
You can even put up a cron to save the output of top commands to some log file. But this is not recommended since it will pile up logfile in no time and hence fill mount point rapidly. Anyway, we have in-depth utilization data being collected by OS which can be viewed using SAR utility.
-f option which is available in HPUX native top utility has few limitations. It stores only the first 16 lines of output to file and it supports only one iteration. 16 lines limitations make logfile quite short and it shows mainly header values CPU, memory, etc. Most of the processes related to data get lost. See example below :
$ top -f /tmp/test
$ cat /tmp/test
System: testsrv3 Wed Dec 21 03:18:19 2016
Load averages: 0.03, 0.04, 0.04
246 processes: 168 sleeping, 78 running
Cpu states:
CPU   LOAD   USER   NICE    SYS   IDLE  BLOCK  SWAIT   INTR   SSYS
 0    0.04   0.0%   0.0%   0.2%  99.8%   0.0%   0.0%   0.0%   0.0%
14    0.03   0.0%   0.0%   0.0% 100.0%   0.0%   0.0%   0.0%   0.0%
15    0.03   0.0%   0.0%   0.2%  99.8%   0.0%   0.0%   0.0%   0.0%
16    0.04   0.0%   0.0%   0.4%  99.6%   0.0%   0.0%   0.0%   0.0%
17    0.02   0.2%   0.0%   0.4%  99.4%   0.0%   0.0%   0.0%   0.0%
18    0.04   0.0%   0.0%   0.0% 100.0%   0.0%   0.0%   0.0%   0.0%
---   ----  -----  -----  -----  -----  -----  -----  -----  -----
avg   0.03   0.0%   0.0%   0.2%  99.8%   0.0%   0.0%   0.0%   0.0%

System Page Size: 4Kbytes
Memory: 1679640K (1411160K) real, 3170312K (2643480K) virtual, 30532328K free  P
CPU TTY  PID USERNAME PRI NI   SIZE    RES STATE    TIME %WCPU  %CPU COMMAND