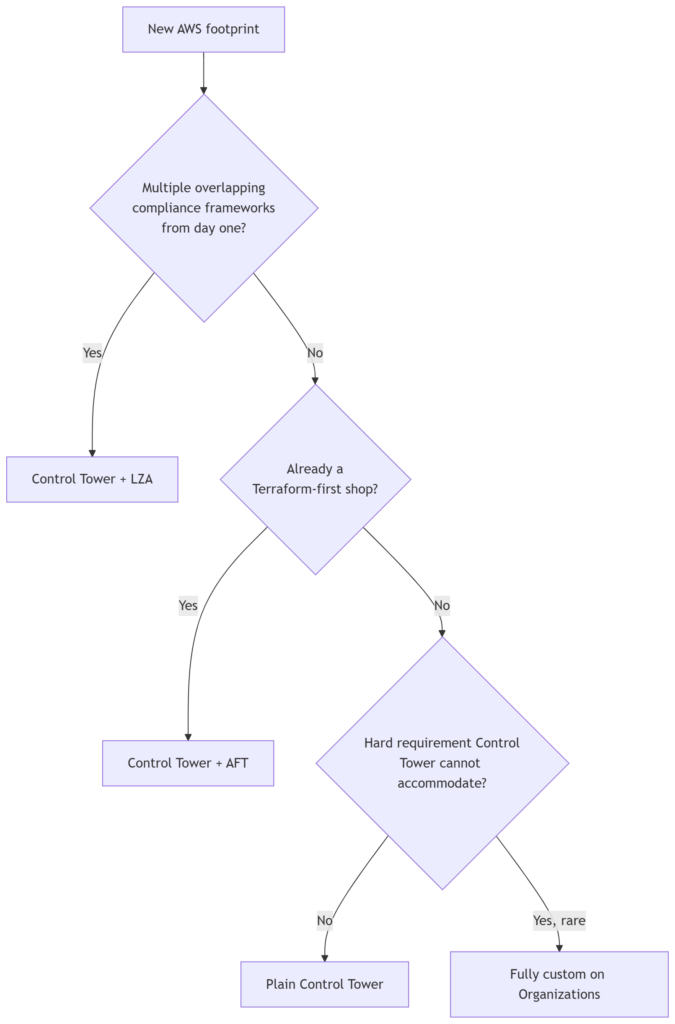
Category Archives: Cloud Services

AWS Landing Zone, Part 3: Transit Gateway, Centralized Egress, and Where IPAM Earns Its Keep

Five VPCs connected by peering need ten peering connections. Ten VPCs need forty-five. Every new VPC means going back into the route tables of every existing VPC to add the new relationship, and every peering connection is a distinct thing that can be misconfigured, forgotten, or left open longer than it should be. That math is the whole argument for hub-and-spoke, and it’s why almost nobody designs a multi-account AWS network as a full peering mesh past the first few accounts.

AWS Landing Zone – Part 3

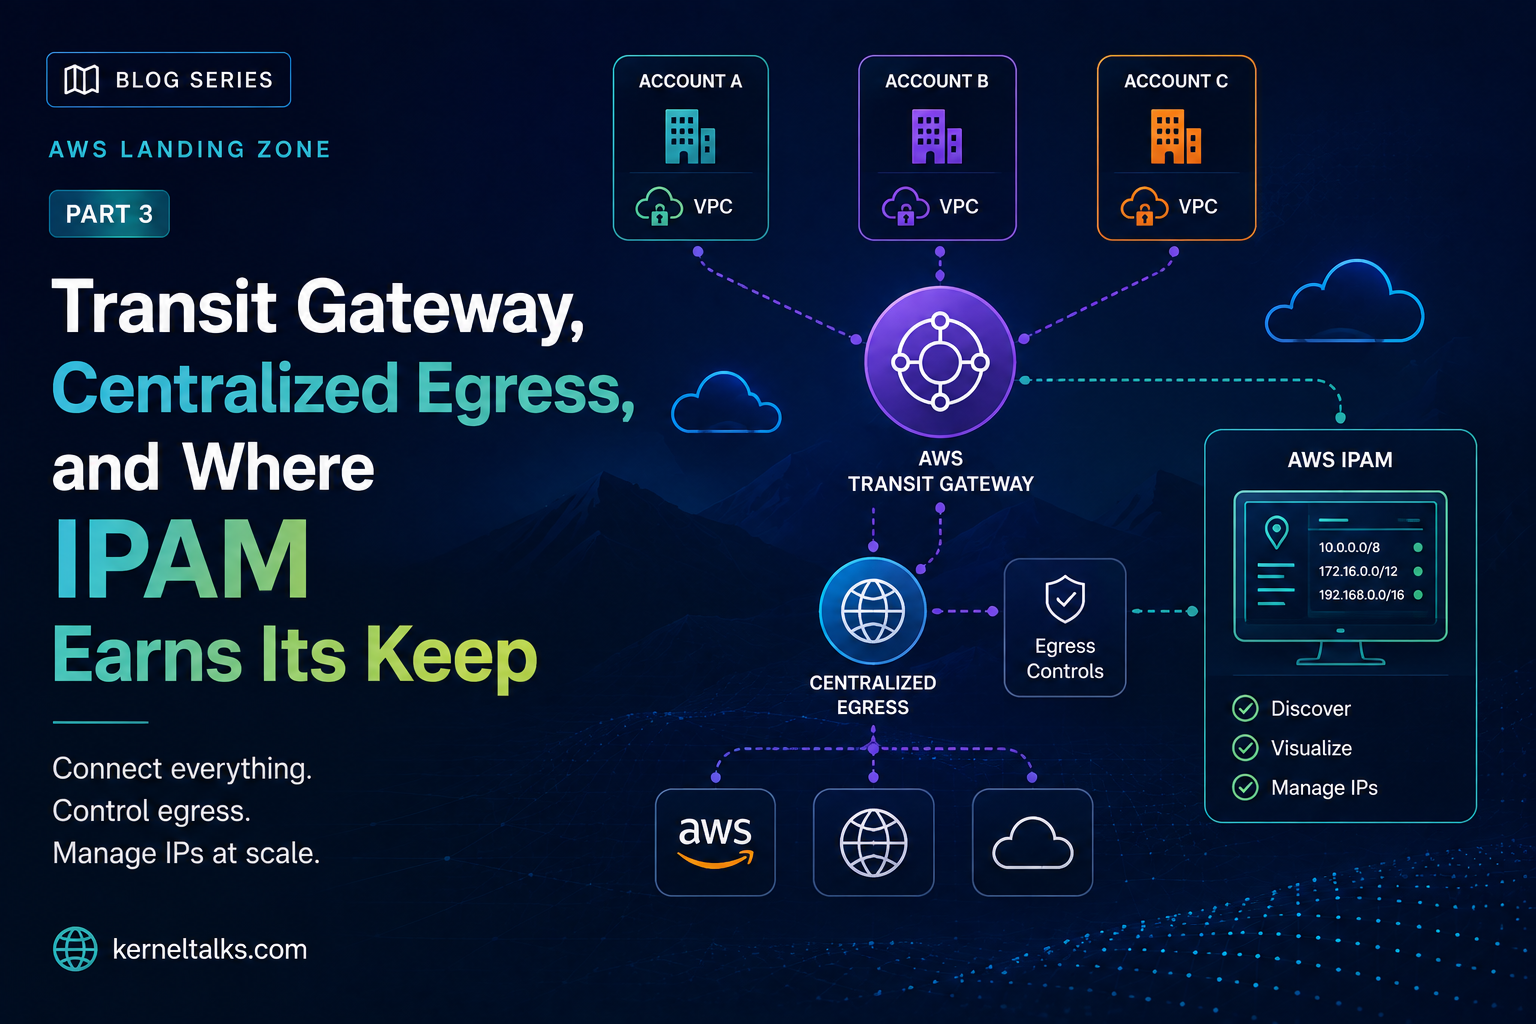
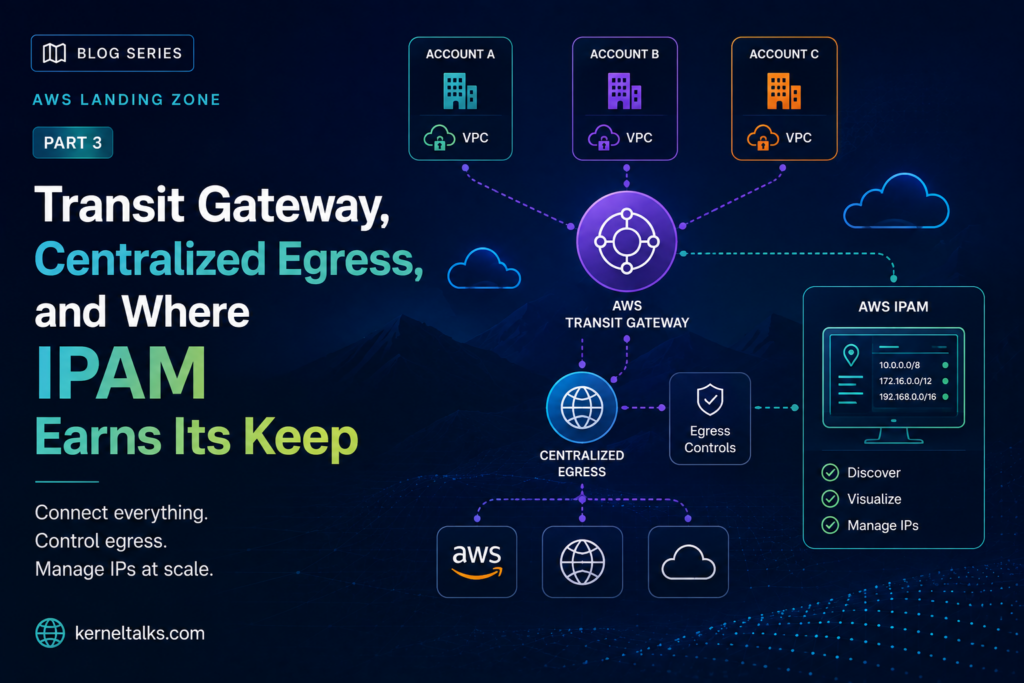
Part 1 and Part 2 covered the account structure and the guardrails that govern it. This post is about the network underneath: Transit Gateway as the hub almost everyone reaches for, centralized egress and what it costs against the alternative, IPAM (IP Address Management) as the CIDR governance layer, and where VPC Lattice fits without pretending it replaces Transit Gateway wholesale.

Transit Gateway as the hub

AWS Transit Gateway is a managed, regional routing hub. Spokes, VPCs, VPN connections, Direct Connect, attach to it once, and it handles routing between them using its own route tables instead of point-to-point relationships. One Transit Gateway per Region is typically enough since it’s highly available by design, though there’s a legitimate case for more than one where you want to limit the blast radius of a routing misconfiguration or separate control-plane operations between teams. Cross-region connectivity happens through Transit Gateway peering; hybrid connectivity, Direct Connect or VPN, attaches the same way a VPC would.

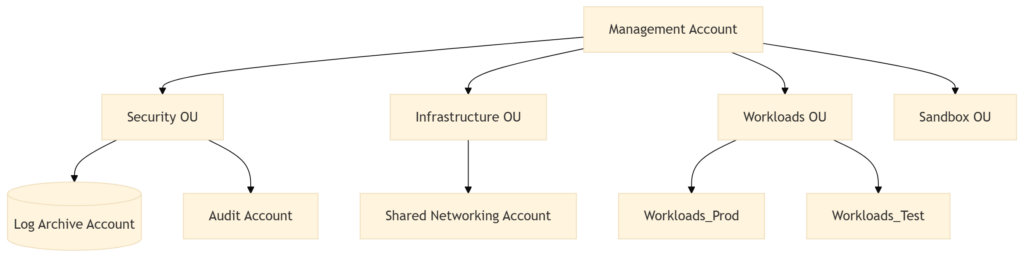
The account this lives in matters. Transit Gateway, IPAM, and centralized egress infrastructure all belong in the Infrastructure OU’s networking account, sometimes literally called Network or Network Hub, not scattered across workload accounts and not in the Control Tower management account. That account becomes the place a network engineer actually works day to day, and it’s worth treating its own access and change process with the same care as the Security OU from Part 2.

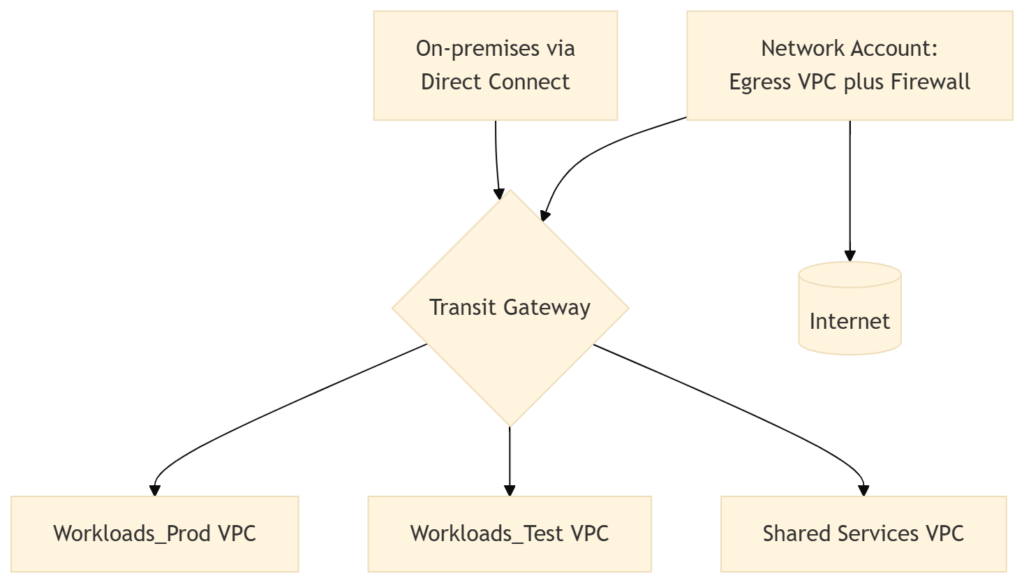
Laid out, the topology looks like this:

Transit Gateway topology!

Every spoke VPC gets one attachment to the hub instead of a direct relationship with every other spoke. Whether Prod and Test can actually reach each other is a routing table decision inside the Transit Gateway, not something the topology forces one way or the other, which is exactly the control you lose with a flat peering mesh.

Centralized egress and what it actually costs

The other big reason to centralize on a hub isn’t just routing hygiene, it’s cost. Every VPC that needs internet access wants its own NAT gateway per Availability Zone for resilience, and NAT Gateway data processing charges add up fast once you’re running dozens of VPCs, each with its own pair or trio of gateways running independently. Centralizing egress means routing outbound traffic from every spoke through the Transit Gateway into a single egress VPC in the network account, where it exits through one set of NAT gateways instead of dozens. One practitioner audit found organizations spending around $15,000 a month on NAT Gateway data processing alone, spread thin across VPC after VPC, and cut that by 40 to 70 percent by consolidating.

Adding traffic inspection to that same choke point is a natural next step. AWS Network Firewall sits in the egress VPC and inspects traffic before it reaches the NAT gateway, at a real but bounded cost, roughly $0.40 an hour per endpoint plus a per-gigabyte processing charge, which is a fair trade in a regulated environment and a harder sell if you’re mostly optimizing for spend. One genuine gotcha here: DNS doesn’t follow this path by default. Route 53 Resolver and DNS Firewall are a separate egress route entirely, so centralizing your data-plane egress through Transit Gateway and Network Firewall doesn’t automatically mean your DNS queries are inspected the same way. If DNS-based filtering matters to your threat model, it needs its own explicit design, not an assumption that it rides along with everything else.

IPAM: get the CIDR plan right before account one

IP address planning is one of those things that’s cheap to fix before it exists and expensive to fix after. Amazon VPC IPAM gives you a hierarchical pool structure, a top-level pool subdivided into regional pools, then further into business-unit or environment pools, so that a new VPC in the Workloads_Test OU pulls its CIDR from a pool already guaranteed not to overlap with Prod, Sandbox, or anything else in the organization. IPAM should be delegated to the network account rather than run from the Control Tower management account, the same separation-of-duties instinct as everything else in this series.

The failure mode IPAM prevents is duller than a security incident but just as disruptive: two teams independently pick 10.0.0.0/16 for their VPCs, everything works fine in isolation, and then someone needs to connect the two networks and discovers the ranges collide. Fixing that after the fact means readdressing a live VPC, which is exactly the kind of maintenance window nobody wants to schedule. Getting the CIDR plan right before the first account exists costs an afternoon. Getting it wrong costs a migration.

Route 53 Profiles solve the equivalent problem for DNS. Instead of manually associating private hosted zones, resolver rules, and DNS firewall rule groups to every VPC individually, you bundle them into a single profile in the network account and share it across accounts through AWS RAM. New VPCs associate with the profile once and inherit the whole DNS configuration, rather than someone remembering to wire up each piece by hand every time an account gets vended.

Where VPC Lattice actually fits

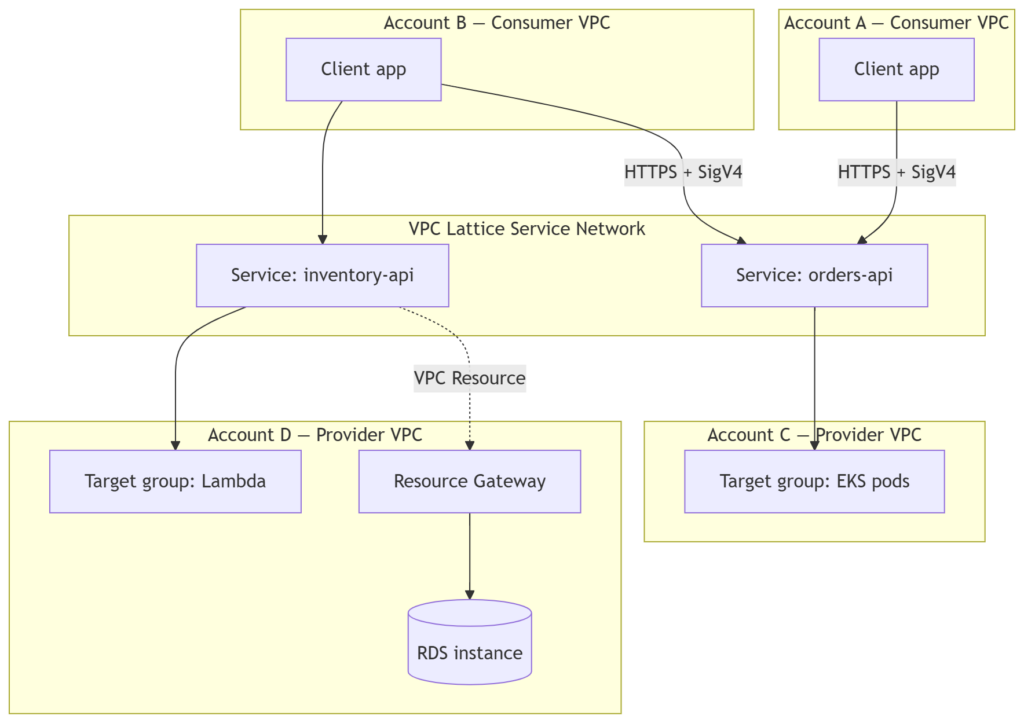
VPC Lattice gets pitched sometimes as a Transit Gateway replacement, and that framing oversells it. Transit Gateway operates at Layer 3, it moves packets between IP addresses and doesn’t know or care which identity sent them; security has to come from route tables, security groups, and NACLs. VPC Lattice operates at Layer 7, HTTP, HTTPS, and gRPC specifically, and it’s service-centric rather than network-centric: services register into a service network, consumers discover them by DNS name, and access is governed by IAM policy rather than which subnet you happen to be in. It’s also currently single-region, so it isn’t a drop-in for anything that needs to span regions the way Transit Gateway peering does.

In practice these coexist rather than compete. Transit Gateway keeps doing the job of moving bulk traffic, hybrid connectivity, and anything that isn’t a clean HTTP service call. VPC Lattice picks up new service-to-service communication where IAM-based authorization is a better fit than managing security group rules across account boundaries. I’d reach for Lattice for a new internal API a team wants to expose across accounts without punching new holes in the network layer, not as a project to migrate an existing Transit Gateway backbone onto.

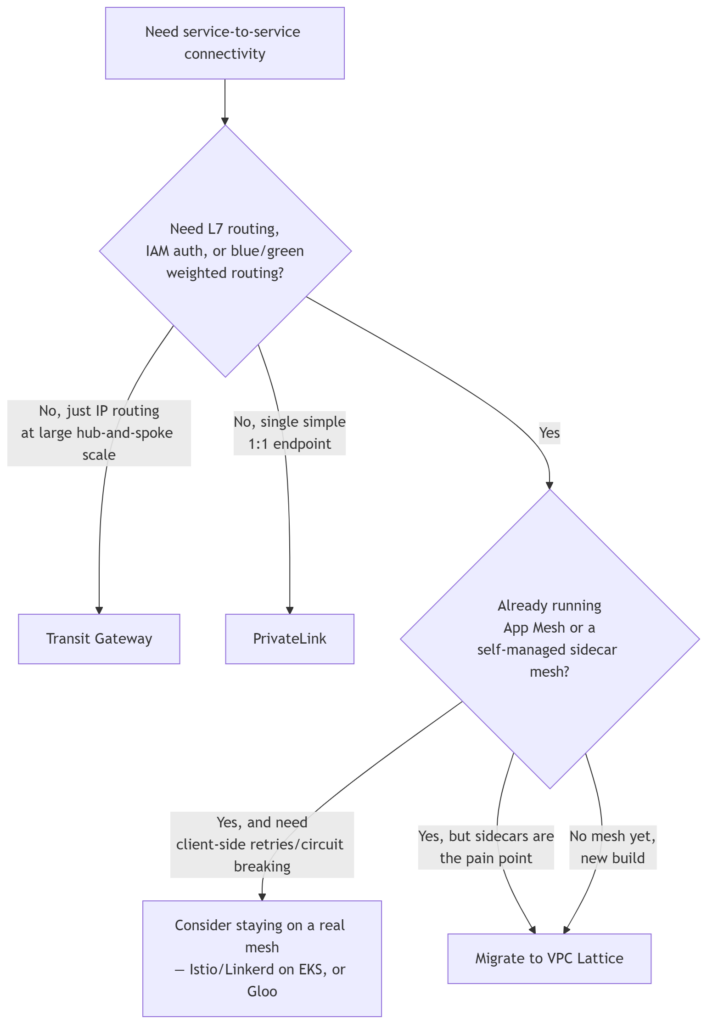
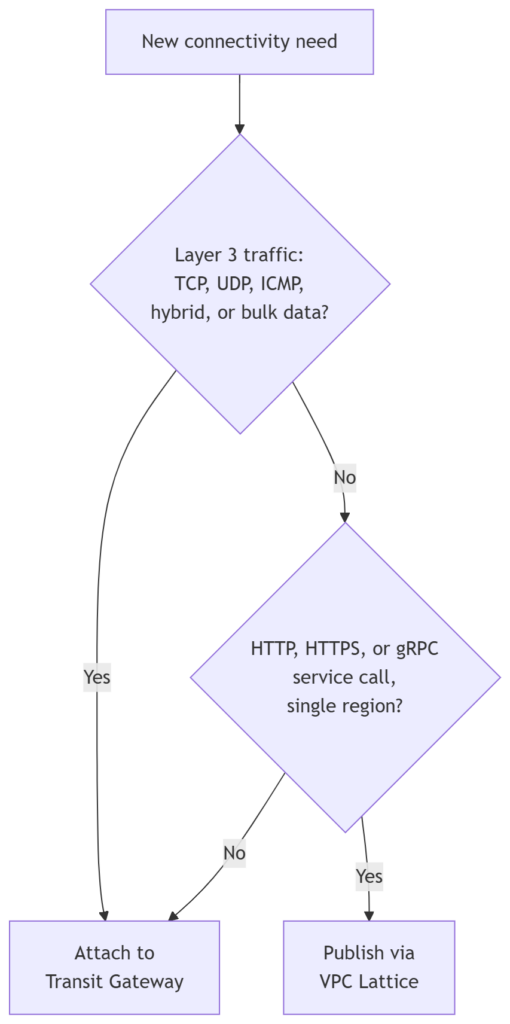
As a decision, it collapses to one real question about the shape of the traffic:

Shaping traffic!

Bulk data, non-HTTP protocols, or anything crossing regions stays on Transit Gateway. A specific, well-defined service boundary within one region is where Lattice earns its keep, and it’s rarely an either-or choice at the level of the whole network.

What’s next

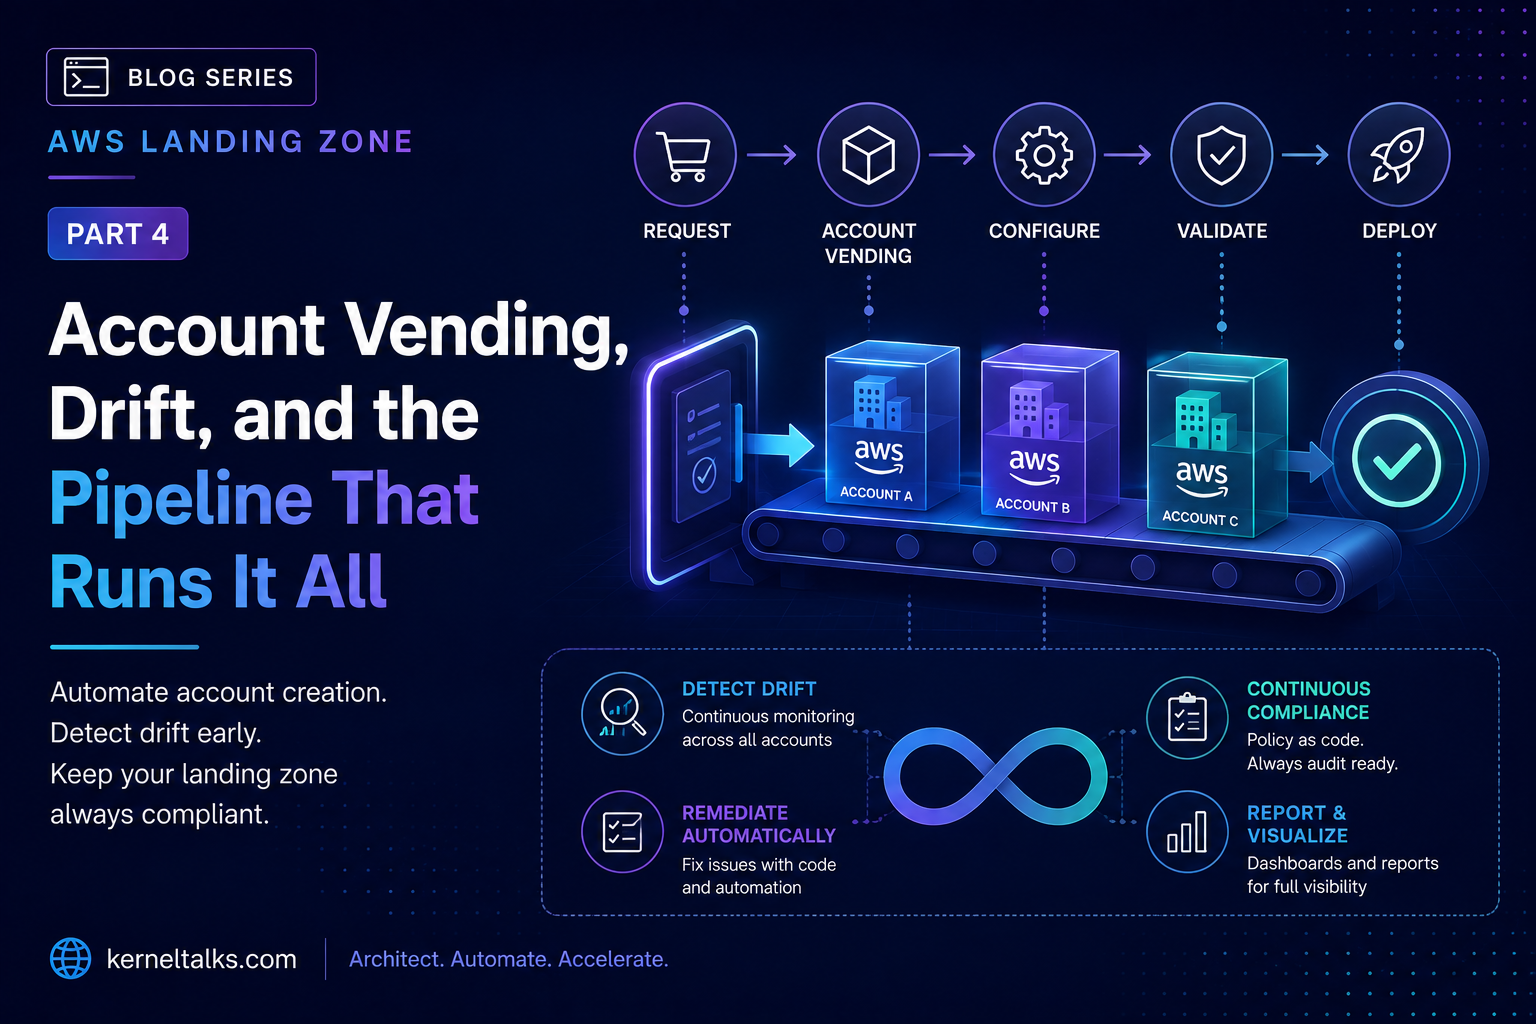
The network is the part of a landing zone that’s genuinely painful to change once workloads depend on it, which is exactly why it deserves the same up-front discipline as the OU structure in Part 1. The last post in this series moves from design to operations: how account vending actually scales once you’re provisioning dozens of accounts a month, why Control Tower can tell you about drift automatically but won’t fix it for you, and the CI/CD pipeline that should sit in front of every change to the guardrails from Part 2 before it reaches a real account.

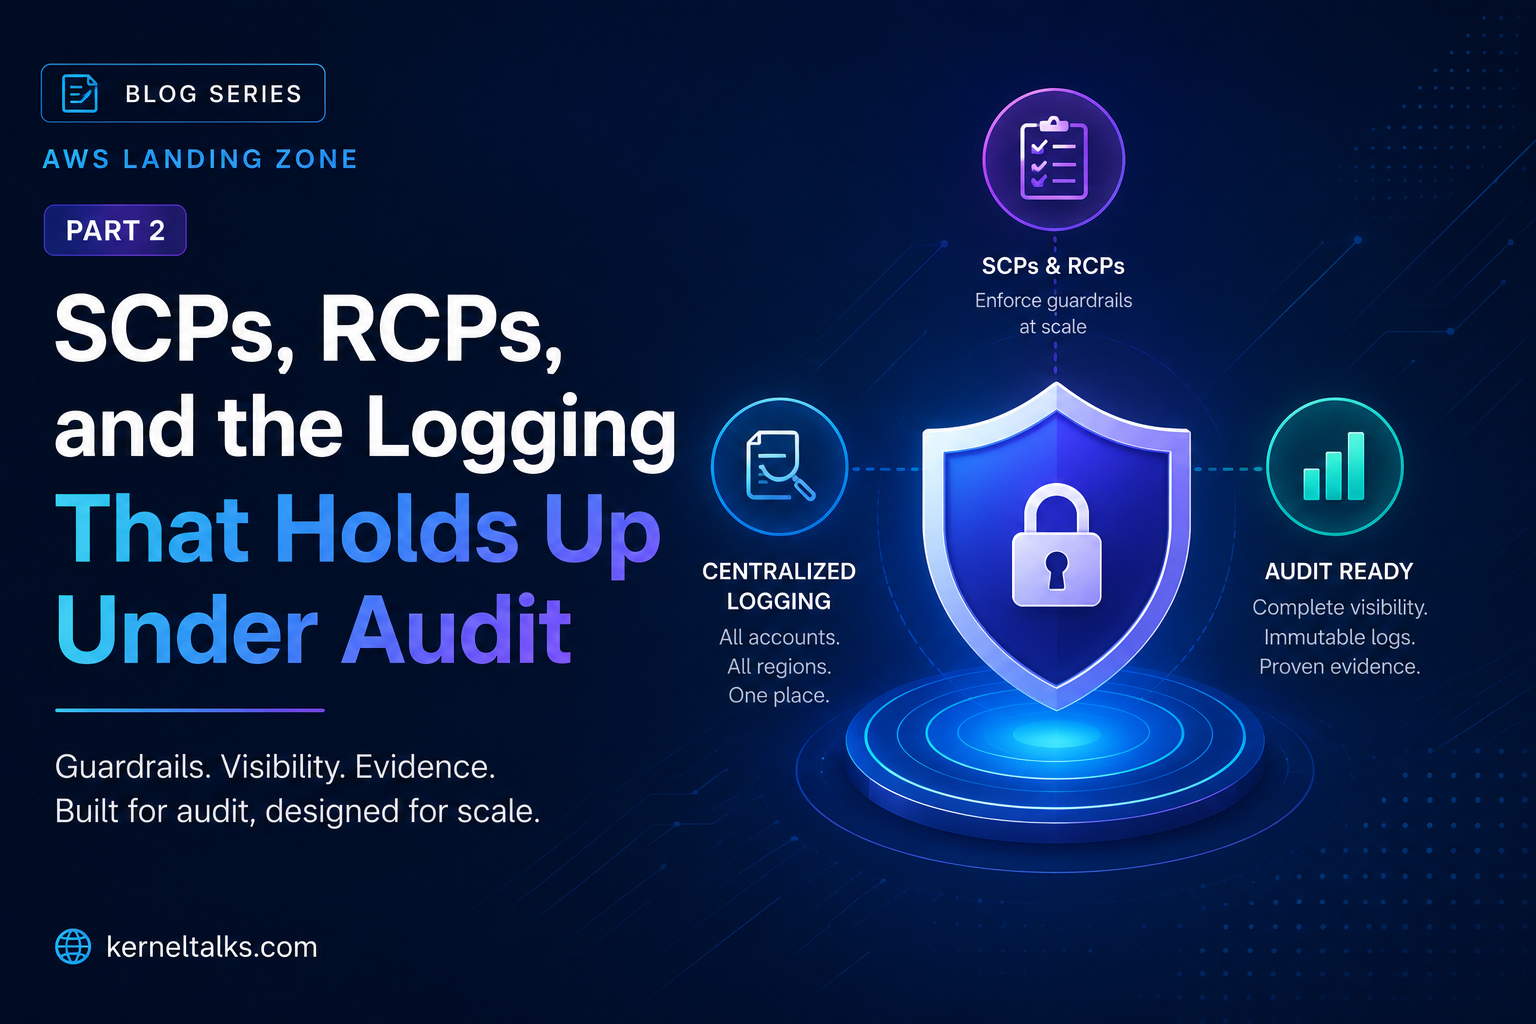
AWS Landing Zone, Part 2: SCPs, RCPs, and the Logging That Holds Up Under Audit

There’s a specific error message in AWS Control Tower that ruins a Tuesday. Someone edits or detaches a managed SCP (Service Control Policy) on the Security OU (Organization Unit), and the console locks you out with a warning that the shared accounts may no longer be working, and that you shouldn’t provision new accounts until it’s fixed. AWS documents this exact failure mode in its own knowledge base, which tells you it happens often enough to need a canonical writeup. The lesson isn’t “don’t touch SCPs.” It’s that the guardrails Control Tower manages for you and the guardrails you write yourself live in the same policy type, and mixing them up on the wrong OU is how you find out which one was load-bearing.

AWS Landing Zone – Part 2

This is Part 2 of the landing zone series. Part 1 covered what a landing zone is and the build-vs-buy decision behind Control Tower, LZA, and AFT. This one is about the layer that actually does the enforcing: service control policies and their newer sibling, resource control policies, the logging architecture that has to hold up when an auditor asks for it, and IAM Identity Center as the one door every human uses to get into any of this.

SCPs and RCPs aren’t the same guardrail

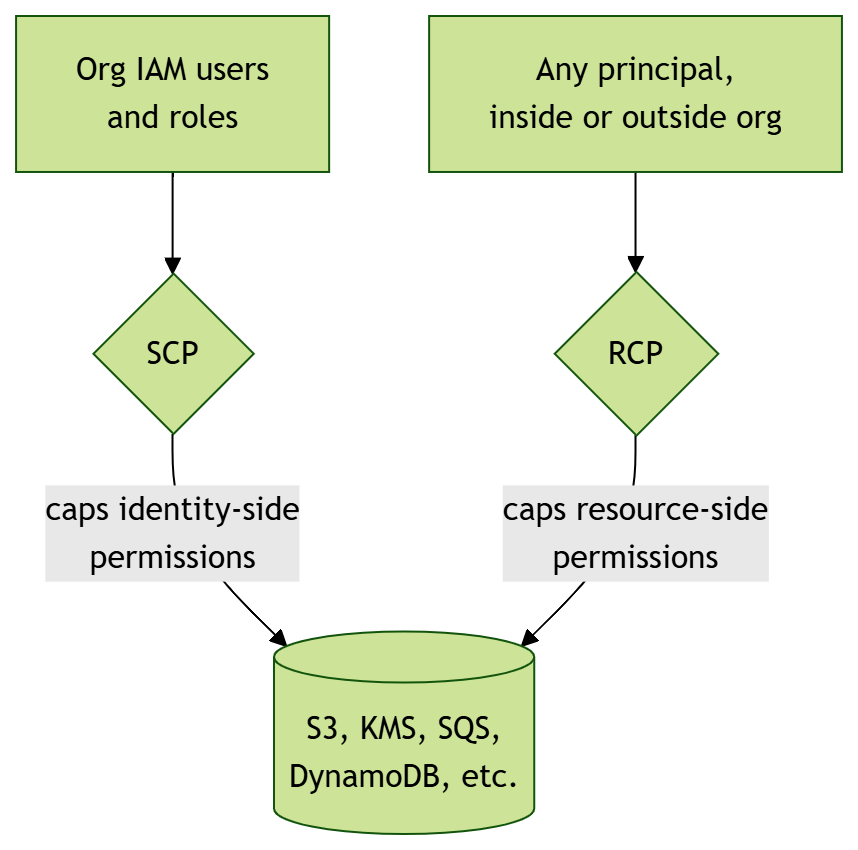
It’s worth being precise here because the names invite confusion. A service control policy caps what your own identities, users and roles inside your organization, are allowed to do, regardless of what their IAM policy says. A resource control policy caps who can touch a given resource, an S3 bucket, a KMS key, an SQS queue, and a growing list of others, regardless of what that resource’s own policy allows. AWS puts it simply: use an SCP to limit your own principals, use an RCP to restrict access to your resources from principals outside your organization. Neither one grants anything. Both are ceilings, not floors, and the permission a principal ends up with is whatever’s left after intersecting the SCP, the RCP, and the identity or resource policy underneath.

RCPs are the newer of the two, and they’re moving fast. They launched in November 2024 covering five services: S3, STS, KMS, SQS, and Secrets Manager. Since then AWS has kept extending the list. Cognito and CloudWatch Logs picked up support in January 2026, DynamoDB followed a few weeks later, and the per-organization quota doubled to 2,000 RCPs this past July. That pace tells you something: RCPs are still filling in gaps, not yet the mature, complete tool that SCPs are. Check the current supported-service list before designing a control around a service it doesn’t cover yet.

SCPs got their own significant upgrade in September 2025, when AWS gave them full IAM policy language support: conditions inside Allow statements, individual resource ARNs, NotAction with Allow, wildcards in the middle of an Action string. Before that update, SCPs were noticeably blunter than a regular IAM policy, which pushed a lot of teams toward broad deny-everything-except statements because anything more surgical wasn’t expressible. Existing SCPs kept working unchanged after the update, but if yours predate September 2025, there’s a real case for revisiting them now that more precise allow-with-conditions patterns are possible.

Where these guardrails get scoped

Tie this back to the OU structure from Part 1. In practice, almost every SCP and RCP you write gets attached at the Security OU, the Infrastructure OU, the Workloads OU, or somewhere in between, and the Security OU is the one to treat with real caution. That’s where Control Tower’s own managed SCPs live, the ones protecting the Log Archive and Audit accounts, and it’s exactly the OU where the lockout scenario above happens. If you need custom guardrails for security tooling, write them, but write them as additions at a level below where Control Tower’s own policies sit, not as edits to the managed ones.

Put visually, the two guardrail types gate different paths to the same resource:

SCPs,RCPs

The distinction matters operationally, not just semantically. An SCP written to block a risky action only stops your own users and roles from doing it. If the same S3 bucket is reachable by a principal from another AWS account entirely, only an RCP, or the bucket policy underneath it, actually stops that. Teams that treat SCPs as a complete security boundary and skip RCPs are leaving exactly this gap open, usually without realizing it until an access review turns it up.

Centralized logging that holds up under audit

Control Tower sets up an organization-level CloudTrail trail automatically, which, since landing zone version 3.0, replaced the older model of a separate trail per account. One trail logs everything, management account and every member account, and delivers into an S3 bucket that lives in the Log Archive account, the one nobody logs into day to day. AWS Config runs alongside it, aggregating configuration history into the Audit account rather than Log Archive, a distinction worth remembering when someone asks where a specific piece of evidence actually lives.

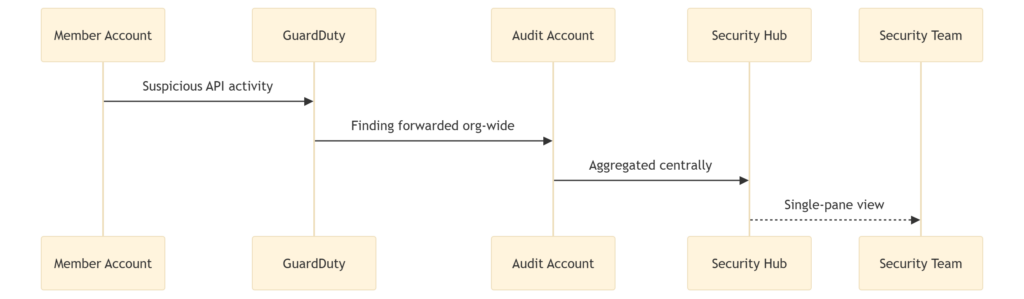
The pattern that makes this scale past a handful of accounts is delegated administration. Instead of every security service being manageable only from the management account, you designate a member account, almost always the Audit account, as the delegated admin for GuardDuty, Security Hub, Config, and similar services, and manage all of them centrally from there without ever touching the management account for day-to-day work. This has expanded well beyond security services specifically; one recent count put the number of AWS services supporting delegated administration at 37, up from roughly a dozen when the pattern first appeared. GuardDuty is regional, so this has to be repeated per Region you actually monitor, which is easy to miss if you’ve only ever tested in one.

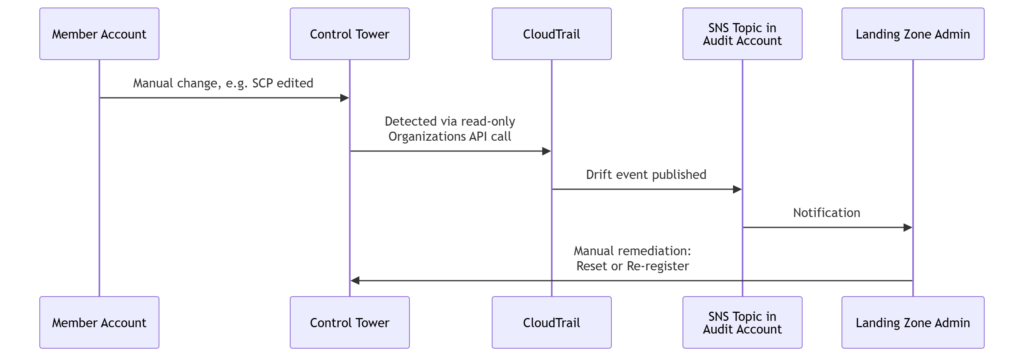
Here’s what that centralization looks like end to end for a single finding:

Sequence of tracking

None of this is exotic engineering. It’s mostly turning on the right delegation and pointing things at the Audit account instead of leaving them scattered. The payoff shows up specifically during an audit, when “show me every API call across every account for the last year” is a single query against one bucket instead of a scavenger hunt across forty.

IAM Identity Center as the only door in

Every human touching any of these accounts should be going through IAM Identity Center, not IAM users with long-lived access keys. The mechanics are straightforward: permission sets define what a person can do, assignments connect a permission set to a group and an account or set of accounts, and Identity Center issues short-lived credentials rather than anything standing. Assign to groups, not individuals. When someone changes teams you move the group membership and every downstream permission follows automatically.

Identity Center federates cleanly with an external identity provider over SAML, Okta, Entra ID, whatever your organization already runs, with SCIM (System for Cross-domain Identity Management) handling user and group provisioning so you’re not managing a second identity store by hand. The one thing every landing zone still needs underneath all of this is break-glass access: a small number of IAM roles or users, outside Identity Center entirely, that work even if federation itself is broken or misconfigured. It’s not a contradiction to have SSO for everything and also keep a locked-down emergency path around it. It’s the same reason a building keeps a physical key next to the electronic badge reader.

One detail worth knowing if you’re serious about treating this whole layer as code: permission sets and their assignments can be managed through a CI/CD pipeline just like the SCPs and RCPs above, JSON templates in a repository, a pipeline reacting to changes and pushing updates to Identity Center. It’s a small thing, but it means access changes go through the same review process as everything else instead of being a console click nobody remembers making six months later.

What’s next

Guardrails and identity get most of the attention in landing zone design because they’re where the compliance conversations happen, but the networking layer underneath all of this has its own decisions and its own ways to quietly overspend. Part 3 covers Transit Gateway and the hub-and-spoke pattern almost everyone converges on, centralized egress and what it actually costs against a pile of per-VPC NAT gateways, IPAM as the CIDR governance layer you want in place before account number one, and where VPC Lattice fits next to Transit Gateway instead of replacing it.

Amazon CloudWatch Managed Prometheus Collectors: Retiring the Self-Managed OTel Collector

Ask anyone who has wired Prometheus metrics into CloudWatch what the real bottleneck was, and it was never Prometheus. It was the collector. You’d stand up an OpenTelemetry Collector as a Deployment or a DaemonSet, hand-tune its scrape config, guess at memory limits for cardinality you hadn’t measured yet, and then spend the next year treating it like one more piece of cluster infrastructure that needed patching, right-sizing, and on-call attention of its own.

AWS Managed Prometheus Collectors

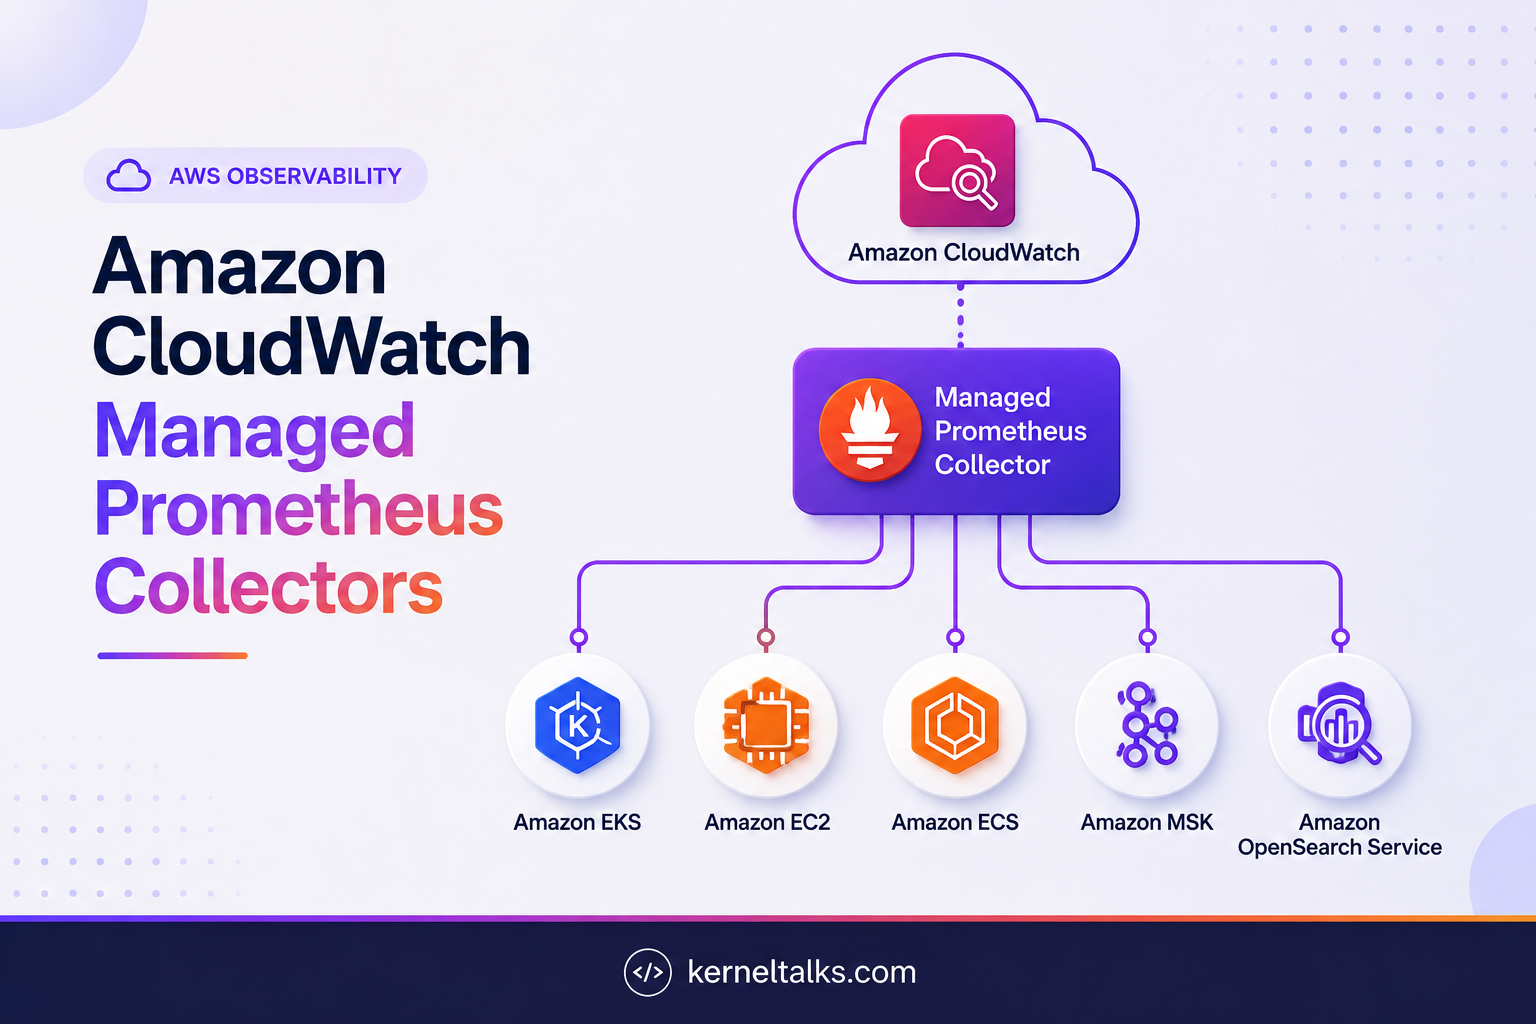
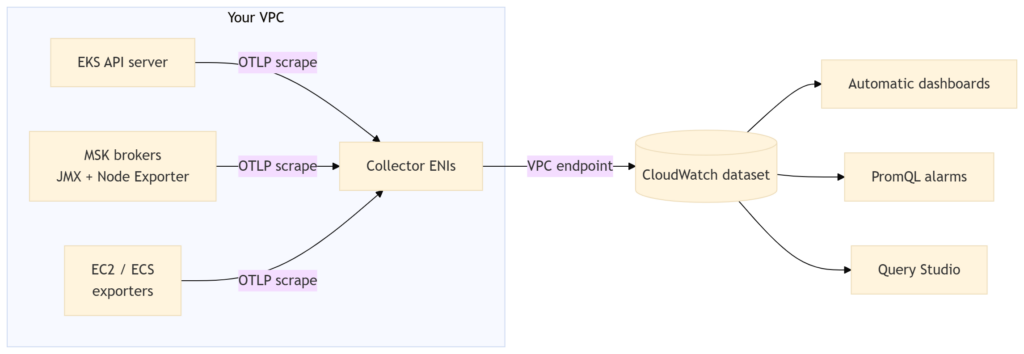
On July 31, AWS announced managed Prometheus collectors for Amazon CloudWatch, a fully managed, agentless scraper for Amazon EKS, Amazon EC2, Amazon ECS, Amazon MSK, and Amazon OpenSearch Service. You supply a scrape configuration and a way to reach your resources, and CloudWatch takes it from there: provisioning the collector, scaling it, and keeping it running. What it scrapes arrives in OpenTelemetry format, queryable with PromQL right next to your AWS vended metrics.

That’s the announcement. The more useful question, if you’ve spent any time in AWS’s observability stack already, is what’s actually new here versus what’s just wearing a new badge.

The new part is the destination, not the collector

This isn’t new collector technology. AWS shipped this same agentless scraper (automatic target discovery, no in-cluster agent, multi-AZ, metrics that never leave your VPC) as the Amazon Managed Service for Prometheus collector back in November 2023, initially scoped to EKS and writing into an AMP workspace. That lineage is visible directly in the API today: you still create one of these with the CreateScraper operation, under the aws amp CLI namespace, not some new CloudWatch-specific command. What’s new in this announcement is the destination and the source list. Alongside an AMP workspace, the same managed collector can now write into a CloudWatch dataset, and the supported sources have grown from EKS-only to include EC2, ECS, MSK, and OpenSearch.

Here’s an EKS scraper creation, adapted from AWS’s setup docs:

aws amp create-scraper \
  --alias "eks-metrics-scraper" \
  --source eksConfiguration="{clusterArn='arn:aws:eks:us-west-2:111122223333:cluster/prod-cluster', \
    securityGroupIds=['sg-0123456789abcdef0'], \
    subnetIds=['subnet-0aaa111','subnet-0bbb222']}" \
  --scrape-configuration configurationBlob=$(cat eks-scrape-config.yaml | base64 -w 0) \
  --destination cloudWatchConfiguration="{datasetArn='arn:aws:cloudwatch:us-west-2:111122223333:dataset/default'}"

Swap that final --destination flag for an ampConfiguration with a workspace ARN and you’re back to the exact collector AWS shipped in 2023. If you’re already running AMP collectors for Grafana dashboards, that’s the useful takeaway: this is an incremental destination option on infrastructure you may already trust, not a new product to evaluate from a cold start.

It also builds on something CloudWatch shipped only six weeks earlier: native OTLP ingestion with PromQL querying, launched June 9. That release is what made CloudWatch a legitimate destination for Prometheus-shaped metrics at all, with per-GB pricing and curated Container Insights dashboards for EKS. Managed Prometheus collectors are the agentless front door to that same pipeline, extended past what Container Insights auto-instruments.

How a scrape actually reaches CloudWatch

The mechanics will feel familiar if you’ve used any managed AWS scraper before. You hand the collector a set of subnets, and it creates an Elastic Network Interface in each one. It scrapes your targets over those ENIs using OTLP, then delivers the result to your CloudWatch dataset through a VPC endpoint. Nothing crosses the public internet.

What isn’t obvious from the diagram is that target discovery differs meaningfully by source, and that’s what determines how much of an existing scrape config actually survives the move:

  • EKS uses Kubernetes service discovery against the cluster API, plus control-plane metrics (kube-scheduler and kube-controller-manager, exposed starting at Kubernetes 1.28).
  • ECS uses DNS-based discovery through AWS Cloud Map, so tasks register once and get picked up without a static IP list.
  • EC2 is static_configs against private IPs, no different from pointing a self-managed setup at a fixed target list.
  • MSK uses DNS-based discovery against the cluster’s own bootstrap DNS name, which resolves to every broker and survives broker replacement without reconfiguration.

MSK is worth a closer look because it needs a prerequisite step: enabling Open Monitoring on the cluster, which exposes a JMX Exporter on port 11001 and a Node Exporter on port 11002. A scrape config covering both looks like this:

global:
  scrape_interval: 60s
  external_labels:
    cluster_name: my-msk-cluster

scrape_configs:
  - job_name: 'msk-jmx'
    dns_sd_configs:
      - names: ['my-cluster.abc123.c4.kafka.us-west-2.amazonaws.com']
        type: A
        port: 11001
    relabel_configs:
      - source_labels: [__address__]
        target_label: instance

  - job_name: 'msk-node'
    dns_sd_configs:
      - names: ['my-cluster.abc123.c4.kafka.us-west-2.amazonaws.com']
        type: A
        port: 11002
    relabel_configs:
      - source_labels: [__address__]
        target_label: instance

That gets you broker-level Kafka metrics (topic throughput, consumer lag, under-replicated partitions) from the JMX exporter, and host-level CPU, memory, and disk metrics from Node Exporter, both queryable with PromQL once they land. Two things to check before you plan around this: MSK Serverless and MSK Express aren’t supported, and public access combined with KRaft metadata mode is excluded too.

The scrape config is Prometheus-compatible, not Prometheus

This is worth reading closely before you migrate anything, because “Prometheus-compatible YAML” undersells how much is actually missing. The supported configuration surface covers global settings, scrape_configs with static_configs and dns_sd_configs, and relabeling. What isn’t there matters more than what is:

  • Minimum scrape interval is 30 seconds. An SLO built on 10 or 15-second scrapes doesn’t fit here.
  • No file_sd_configs, and no Consul, Eureka, or other external service discovery. If your target list comes from anywhere other than Kubernetes, Cloud Map, a static list, or MSK’s broker DNS, this collector can’t reach it.
  • remote_write and remote_read don’t apply, because delivering to CloudWatch is the whole job. A fan-out to a second backend doesn’t carry over.
  • Configuration blobs cap out at 256 KB, base64-encoded.

None of this is really a flaw. It’s the standard trade-off of a managed service. AWS narrowed the surface to what it can operate reliably at scale, and the narrowing happens to remove exactly the parts of Prometheus configuration that are hardest to run safely inside someone else’s control plane. But “copy your existing prometheus.yml over” is rarely literally true. Diff your current scrape configs against this list before you commit to a cutover date, not after.

What ships automatically, and what doesn’t

EKS and MSK both get a curated dashboard the moment metrics start flowing — EKS OTel and MSK OTel in the CloudWatch console — plus attribute enrichment on every metric: account, region, an inferred unit, and for EKS specifically the cluster name and ARN. That enrichment is what makes PromQL filtering pleasant instead of an exercise in label archaeology. The EC2/ECS path doesn’t come with an automatic dashboard, which is a reasonable trade given how varied EC2/ECS metric shapes are in practice, but it’s worth knowing before cutover rather than after.

Operationally, a managed collector vends its own logs to CloudWatch Logs covering target discovery, scrape successes and failures, and configuration errors, and you manage the scraper itself with aws amp list-scrapers, describe-scraper, and delete-scraper. Deleting one tears down its ENIs, and that cleanup takes a few minutes, so don’t script an immediate re-create into the same subnet.

Cross-account guidance has shifted too. Instead of the role-chaining pattern AMP has historically used for cross-account scrapers, AWS’s current recommendation for both EKS and MSK is CloudWatch metric centralization: replicate the metrics to a monitoring account rather than granting the scraper cross-account reach in the first place.

What this actually costs

Pricing has two components that scale independently, and it’s worth keeping them separate. The collector itself is billed hourly, similar in shape to an ENI or a NAT gateway, though the specific per-hour rate isn’t broken out yet on AWS’s public pricing page as of this writing. What is confirmed is that everything the collector delivers rides on standard CloudWatch OpenTelemetry ingestion pricing: currently $0.50 per GB for general OTel metric publishing, a flat rate that bundles in fifteen months of storage with no separate per-metric or per-API charge. A typical data point with ten to fifteen attributes runs 300 to 600 bytes, for a sense of scale. Console PromQL queries (Query Studio, dashboards) are free; programmatic PromQL queries cost $0.01 per million samples scanned.

That per-GB model is a real shift in how you’d think about cost here. Classic CloudWatch metrics billed per unique metric-dimension combination, so cardinality was the thing to fear. Under OTel ingestion, cardinality by itself is free; what costs money is the serialized size of each data point, which grows with the number and length of the labels attached to it. Fifteen short labels on a metric barely move the needle regardless of series count. A handful of long, high-cardinality values move it fast: unbounded request IDs, verbose ARNs repeated on every point. If you’re porting scrape configs over from a self-managed setup, that’s the moment to prune labels you’ve been carrying out of habit rather than actual query need.

One more line item: scraping itself can rack up VPC data transfer charges between the collector and your targets, separate from CloudWatch ingestion. AWS’s own suggestion is to enable gzip on your /metrics endpoints, which cuts transfer cost without changing what actually gets ingested.

Where I’d actually reach for this

If your team is already CloudWatch-centric and has been putting off a real Prometheus setup mainly because nobody wanted to own collector infrastructure, this closes that gap cleanly. For EKS and MSK metrics specifically, it’s a solid default: alarms and dashboards in the same place as everything else, without standing up Grafana and an AMP workspace just to get there.

I’d still keep a self-managed collector, or the AMP-workspace version of this same scraper, in a handful of specific situations: sub-30-second scrape requirements, target discovery through Consul, Eureka, or file-based service discovery, or a remote_write fan-out to more than one backend because you’re mid-migration or running a deliberately multi-vendor setup on purpose. None of those are rare for a mature platform team, so this doesn’t replace the self-managed path outright. It’s a genuinely good default for the common case, which happens to be most of it.

Availability is broad but not universal — it’s live everywhere CloudWatch’s OTLP endpoint already exists, minus Asia Pacific (New Zealand) for now. Worth checking before you write the migration runbook, not after you’ve scheduled it.

Self-Managed S3 Buckets for Lambda Code: You Finally Own the Artifact


Picture a platform team running a few hundred Lambda functions across a handful of accounts. Every function has several published versions kept around for safe rollbacks. One morning a deploy fails with a quota error, and the culprit isn’t the new function at all. It’s the 75 GB account-level limit on function and layer code storage, quietly filled up by copies of packages you thought lived in your own S3 bucket. If you’ve ever had to explain to a security reviewer why your deployment artifacts also sit in an internal bucket you can’t see, encrypt, or tag, this one is for you.

S3 buckets for Lambda code!

AWS has added a way to point Lambda at your own S3 bucket and have it read your code from there directly, with no hidden second copy.

What actually changed

There’s a new function configuration setting called S3ObjectStorageMode. It has two values.

  • The default is COPY, which behaves exactly like Lambda always has. If you don’t set the field at all, you get COPY, so nothing about your existing functions changes on its own.
  • The new value is REFERENCE. Set it when you create or update a function, and Lambda stops copying your .zip package into its internal storage. Instead it keeps a reference to your S3 object and reads the code from your bucket when it needs it. Your object becomes the one canonical artifact.

The feature works in all AWS standard regions where Lambda is available, and there’s no extra charge for it beyond the normal S3 storage and request costs you’d pay anyway.

How it works, old way and new

Under the old model (now COPY), the flow looks like this: you upload a .zip to your bucket, call CreateFunction or UpdateFunctionCode with the bucket name and object key, and Lambda pulls that artifact into a service-managed bucket. It builds the optimized, runnable version of your function from that internal copy. The catch is that this copy counts against your 75 GB account quota, and you have no say over how it’s stored.

With REFERENCE, that copy step disappears. Lambda records where your object lives and reads it directly. Two things fall out of that. First, your package no longer counts toward the 75 GB limit, because there’s no Lambda-side copy to count. Second, creating and updating functions gets faster, since Lambda skips the copy-into-internal-bucket step. AWS describes this as a faster time to first invoke for new functions and after updates.

Architecture

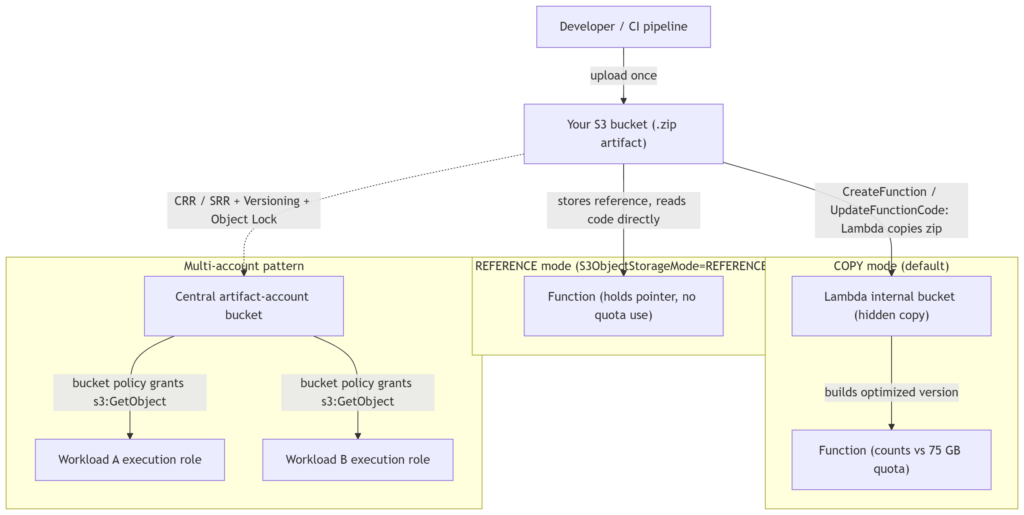
The diagram below contrasts the two modes and sketches the multi-account pattern that, in my experience, is the real reason to adopt this.

Two modes for S3 buckets of Lambda code.

In a COPY deployment, the artifact exists twice: once in your bucket, once inside Lambda. In REFERENCE mode there’s a single object, and your function holds a pointer to it. Extend that to an organization and the shape gets interesting: put every artifact in one bucket in a central “artifact” or shared-services account, then grant s3:GetObject to each workload account’s Lambda execution role through the bucket policy. Now one bucket is the source of truth for what’s deployed everywhere, with one place to enforce encryption, versioning, and retention.
When to reach for it

  • CI/CD and artifact management. Your pipeline uploads a package once, and the function references that same object. One set of lifecycle rules and access controls covers everything, and a rollback becomes “point the function at the previous S3 object version.”
  • Multi-account, multi-team setups. Centralize artifacts in one account, hand out cross-account s3:GetObject via bucket policies, and keep a single inventory of what code runs where.
  • Disaster recovery. Because you own the bucket, you can turn on Cross-Region Replication (CRR) or Same-Region Replication (SRR), and pair it with S3 Versioning and Object Lock to keep a tamper-resistant archive that survives an accidental delete or a corrupted deploy. See the S3 replication docs and S3 lifecycle examples.
  • Quota and compliance pressure. If you’re brushing up against 75 GB, or you need your own encryption, access logging, Object Lock, or compliance tags on the artifact, this gives you that control.

When to leave it alone

For plenty of workloads, COPY is fine and simpler. If you aren’t near the quota, don’t need custom encryption or tagging on the artifact, and have no DR requirement on your deployment packages, there’s little reason to change anything. The default exists for a reason.

Security notes

  • The trade in REFERENCE mode is control for responsibility. You now own the bucket’s posture: its encryption, access policies, lifecycle transitions, and audit trail are yours to configure and to get right.
  • For cross-account access, you grant s3:GetObject to the calling function’s execution role in the bucket policy.
  • Versioning plus Object Lock is the combination worth setting up early if you care about a durable, tamper-proof code archive.
  • The full IAM and bucket-policy details live in the Lambda developer guide.

Pricing

No additional charge for the feature. You pay the standard S3 storage and request costs for the object, which you were largely paying already if your artifacts lived in S3.

Limitations and open questions

It doesn’t state whether REFERENCE needs KMS decrypt permissions beyond s3:GetObject when you use customer-managed encryption (It should), exactly how a referenced object version is pinned for rollback, or what happens to a live function if the referenced object is later deleted or modified. Any latency effect from reading code directly at runtime isn’t discussed either. Confirm these against the Lambda console and the developer guide before you roll it out widely.

Bottom line

This is a small setting with an outsized effect for teams operating at scale. If the 75 GB quota or “we can’t audit that copy” has ever slowed you down, S3ObjectStorageMode: REFERENCE is worth a look. Start on a non-critical function, get your bucket policy and versioning right, and expand from there. Original announcement on the AWS Compute Blog.

Lambda MicroVMs: When Functions Aren’t Enough and EC2 Is Too Much

Picture this: you’re building a browser-based notebook where data analysts paste in Python, load a 3 GB dataframe, generate a few charts, then wander off to a meeting. Ninety minutes later they come back and expect their kernel, their variables, and their half-finished plot to still be sitting there.

AWS Lambda MicroVMs

Now try to build that on what AWS gave you before June 2026. Lambda? Fifteen-minute execution ceiling, no persistent process between invocations, no way to hold that dataframe in memory across the analyst’s coffee break. ECS or EC2? Sure, but now you’re running per-user containers or VMs, paying for idle capacity, and writing your own scheduler to reap dead sessions. Fargate gets you closer, but you still own the isolation story when the code being run was generated by an LLM you can’t fully trust.

This is the gap Lambda MicroVMs is aimed at.

What actually launched

AWS Lambda MicroVMs is a new compute primitive that exposes the Firecracker virtualization layer (the same one that has always run underneath Lambda) as something you can address directly. You get per-instance hardware isolation, snapshot-based startup, and — this is the part that matters — the ability to keep a single execution environment alive for an entire working session rather than a single request.

Alongside it, AWS shipped a companion resource called the Lambda Network Connector (LNC), which is how you attach a MicroVM to a private VPC when you need it to reach a database or an internal API.

How it actually works

Two resource types, and once you understand these the rest falls into place:

  • MicroVM image: a versioned artifact you build from a Dockerfile. When you create one, the service runs your Dockerfile, boots your application inside a MicroVM, and takes a Firecracker snapshot of the memory and disk state. Think of it as a “warm” image — dependencies already imported, JIT already warmed, whatever init your app does already done.
  • MicroVM: an instance launched from that image. Because it’s restored from a snapshot rather than cold-booted, it comes up close to instantly.

Each MicroVM gets its own HTTPS endpoint, and that endpoint speaks to individual ports on the guest — plain HTTPS, WebSockets, and gRPC all work, so you connect to it the same way you’d connect to any container you were running yourself.

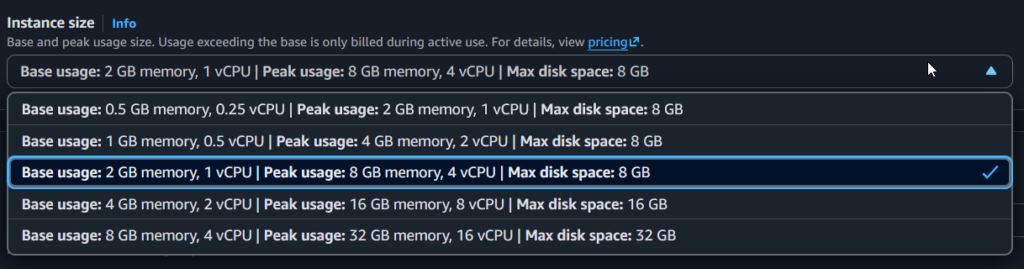
On sizing: the default baseline is 2 GB of memory and 1 vCPU. You can configure that up to 8 GB and 4 vCPUs at launch, with vCPU pinned to memory at a 2:1 ratio (memory in GB is double the vCPU count). From whatever baseline you pick, a MicroVM will auto-scale vertically up to 4x during peak demand. Horizontally, the service claims you can launch several hundred MicroVMs inside a minute.

Lambda MicroVMs Instance Sizes

Sessions can run from a few minutes up to eight hours. Egress to the public internet works out of the box; VPC access requires the LNC.

Architecture

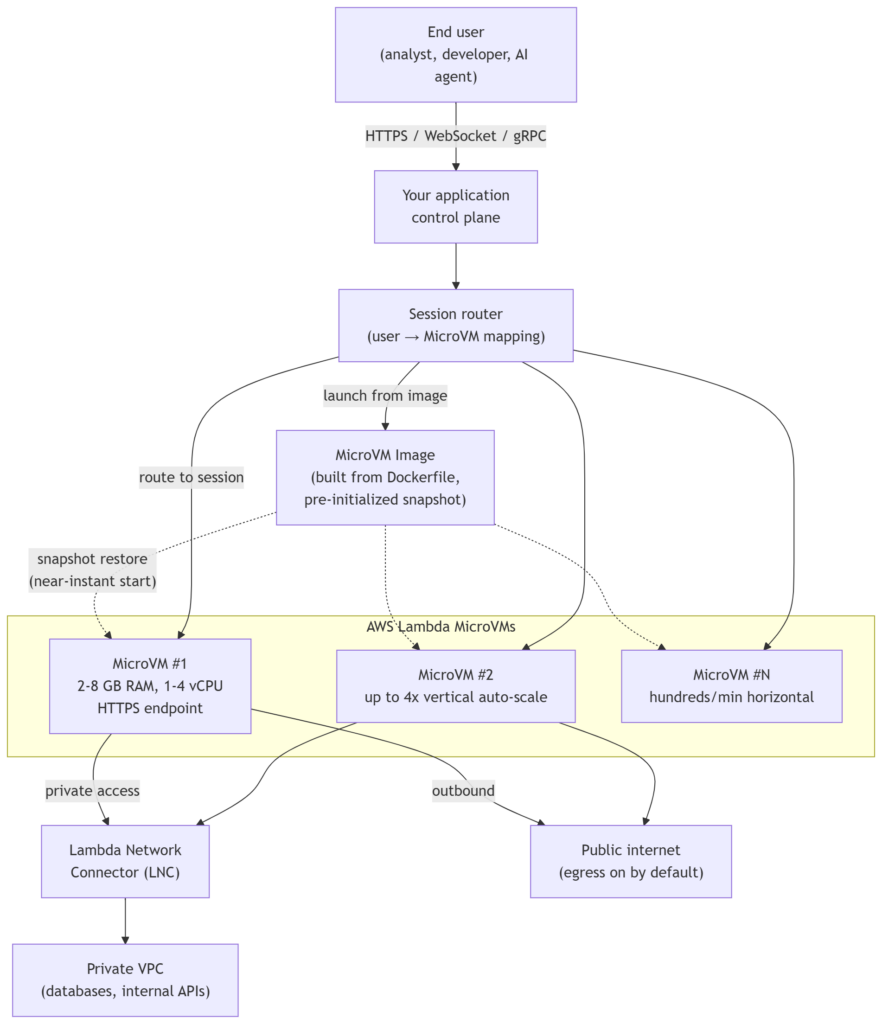
See the diagram below. The pattern is the per-session model: user requests come into your control plane, the control plane looks up whether that user already has a live MicroVM, and either routes traffic to the existing HTTPS endpoint or launches a new instance from a MicroVM image. When the user goes idle, you decide the lifecycle — keep it warm, snapshot it, or let it go.

AWS Lambda MicroVMs Flow

The interesting design question isn’t really “how do I launch a MicroVM” — it’s “who owns the session-to-endpoint mapping, and what’s my policy when the user disconnects?” You will end up building a small state machine. Plan for it.

When this is the right tool

  • Browser-based IDEs, notebooks, and the current wave of vibe-coding platforms — anywhere users bring their own code and expect their environment to feel persistent.
  • Analytics platforms running user- or LLM-generated queries where the working set is large and the session is long.
  • AI coding assistants that iterate on generated code and want to hold context between iterations, including RL-style loops that spin environments up and down to compare execution paths.
  • Security and vulnerability scanning where you need real isolation between scans and sometimes elevated OS privileges inside the guest.
  • CI/CD build and test runners where each job wants a clean, isolated box that starts fast.

When it probably isn’t

The launch material doesn’t call out anti-patterns directly, so treat this as my read rather than AWS’s guidance:

  • If your workload is stateless per-invocation and short, regular Lambda is still simpler and cheaper reasoning-wise.
  • If you need more than 8 GB of memory or 4 vCPUs per instance, you’re outside the MicroVM baseline envelope and you should look at Fargate or EC2.
  • If your sessions genuinely need to outlive eight hours without a snapshot/resume, this isn’t your primitive either.

Security notes worth reading twice

The isolation story is genuinely strong — hardware-level, one guest per user or job, which is the whole point of using Firecracker as a primitive rather than just a container runtime. That’s what makes it defensible as a sandbox for untrusted or model-generated code.

Two things to design around, though.

  1. First, outbound internet access is on by default. If you’re running untrusted code, you almost certainly want egress controls, and the launch material doesn’t spell out how granular those are — treat this as a question to answer before you go to production.
  2. Second, private VPC connectivity is not a checkbox; it requires configuring an LNC. Factor that into your networking design early, not late.

Pricing

Lambda MicroVMs are priced per instance-second. Check the Lambda pricing page (MicroVMs tab) before you commit to a design, especially for long-lived sessions — an eight-hour idle MicroVM has very different economics from a 200 ms function invocation.

Limitations to keep on the whiteboard

  • 2 GB / 1 vCPU baseline, 8 GB / 4 vCPU max, 2:1 memory-to-vCPU ratio.
  • Vertical auto-scale capped at 4x baseline.
  • Horizontal scale advertised as “several hundred per minute” during spikes — quantify this against your own burst profile before betting on it.
  • Sessions in the “few minutes to 8 hours” range; the exact hard upper bound isn’t explicitly stated.
  • VPC access is opt-in via LNC.

Wrapping up

The most useful way to think about Lambda MicroVMs is that AWS unbundled Firecracker from Lambda’s request/response model and let you address it directly, while keeping the parts of Lambda that were actually pleasant — no capacity planning, no patching, no scheduler to write. If you’ve been building per-user sandboxes on top of ECS or bare EC2 and feeling like you were re-implementing Firecracker badly, this is the primitive to evaluate.

Start with the product page and the developer guide, and if snapshot-based startup is new to you, the older SnapStart post is worth a read for the mental model. Networking details live in the LNC docs, and quotas are on the service limits page. And refer to this AWS Blog which walk you through AWS MicroVms.

Know about Amazon GuardDuty Investigation: AI-powered security analysis

Security teams routinely burn hours triaging a single GuardDuty finding. The workflow is familiar: pull the finding, pivot into CloudTrail, cross-reference VPC flow logs, chase the principal across accounts, map the behavior to a known technique, and finally decide whether the alert is a real incident or noise. Multiply that across an organization producing dozens or hundreds of findings a day, and investigation backlog becomes the bottleneck — not detection.

Amazon GuardDuty is now addressing that bottleneck directly. The GuardDuty investigation is available in public preview and performs on-demand, AI-powered investigations of GuardDuty findings, returning a structured assessment that a human analyst would otherwise assemble by hand.

What changed

The investigation agent adds a new capability to Amazon GuardDuty: rather than only surfacing findings, GuardDuty can now investigate them for you. Each investigation produces a structured output that includes a risk level, a confidence score, a natural-language summary, investigation details, MITRE ATT&CK technique mappings, resource mappings, and prioritized recommended actions — including specific AWS CLI commands the analyst can execute.

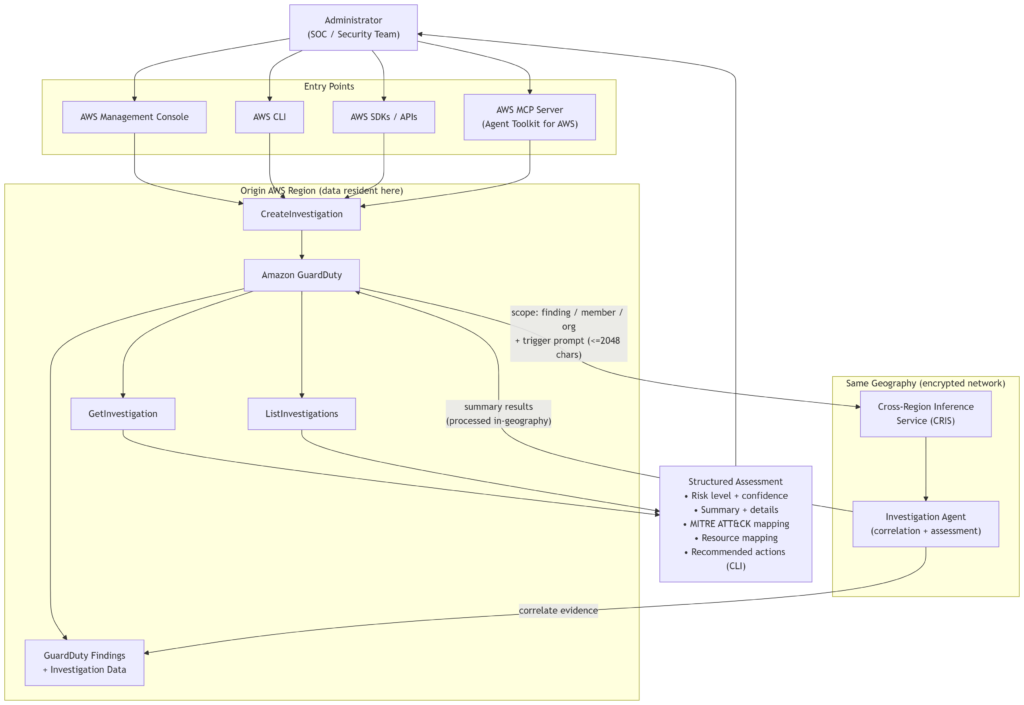
The agent is accessible through the AWS Management Console, the AWS CLI, AWS APIs, AWS SDKs, and the AWS MCP server — meaning it slots into both console-driven workflows and agentic security tooling built on top of the Agent Toolkit for AWS.

How it works

An investigation is initiated by an caller with appropriate permissions through the GuardDuty console, by calling the CreateInvestigation API, or via the AWS CLI. The target can be:

  • a specific GuardDuty finding
  • a member account
  • an entire AWS organization

CLI and API callers can supply a free-form natural-language trigger prompt of up to 2,048 characters to steer the investigation — for example, focusing the agent on a particular hypothesis or scope.

Under the hood, the agent correlates findings and evidence and returns a structured assessment. Results are retrieved with GetInvestigation, and prior investigations can be enumerated with ListInvestigations.

Processing uses cross-Region inference via the Cross-Region Inference Service (CRIS). Investigation data remains stored in the Region where the investigation was created, but inference and summary generation may occur in another Region within the same geography, transmitted over Amazon’s encrypted network.

Please go through this very detailed AWS blog that walks you through the whole investigation process – Amazon GuardDuty investigation agent: on-demand AI-powered threat assessment.

Architecture

The accompanying diagram shows the request flow: an administrator triggers an investigation from the console, CLI, SDK, API, or an MCP-connected agent; GuardDuty accepts the request in the origin Region; CRIS performs inference in-geography; and the structured assessment is returned to the caller while the underlying investigation data stays resident in the origin Region.

When to use it

The investigation agent fits naturally when you want to:

  • Triage a single GuardDuty finding without a manual pivot chase
  • Assess security posture across an entire AWS organization
  • Reduce manual correlation of evidence spread across CloudTrail, VPC flow logs, and other GuardDuty data sources
  • Wire GuardDuty investigations into AI-assisted security workflows through the AWS MCP server
  • Produce on-demand, structured threat assessments consumable by downstream automation

When not to use it

The agent is not the right tool if:

  • GuardDuty is not enabled in the account or organization
  • You are operating in a Region that does not support the preview
  • You need a member account to view another member’s or the administrator’s investigations, which is not permitted

Security considerations

Architecturally, three points matter for a review.

First, cross-Region inference. Investigation data is stored only in the origin Region, but processing and summary results may traverse another Region in the same geography. If your data-residency posture is scoped to a single Region rather than a geography, this is worth an explicit review before enabling the feature in regulated workloads. Please refer geography and their inference regions here.

Second, transport. Data moves across Amazon’s internal, encrypted network — but the residency point above still stands independently of encryption in transit.

Third, authorization. Investigations honor the existing GuardDuty authorization model. Callers can investigate only accounts they are already authorized to access. The three IAM actions to allow on principals that will drive investigations are:

  • guardduty:CreateInvestigation
  • guardduty:GetInvestigation
  • guardduty:ListInvestigations

Scope these on the administrator account role that runs the SOC’s investigation workflow, not broadly.

Pricing

In Preview mode, GuardDuty Investigations are made available at free of cost. Confirm current pricing in the GuardDuty product page before enabling at scale once its GA.

Limitations

  • The feature is in public preview.
  • GuardDuty must already be enabled, the account must be in a supported Region, and only administrator accounts can create investigations in admin as well as member accounts.
  • Member accounts cannot access investigations belonging to peer members or to the administrator.
  • Cross-Region inference behavior described above also applies.
  • During preview, 10 investigations/account/day with total limit of 100 investigations/account.Failed investigations do not count toward these quotas.
  • This feature is available only in the following 10 commercial AWS Regions: US East (N. Virginia), US East (Ohio), US West (Oregon), Canada (Central), Europe (Frankfurt), Europe (Ireland), Europe (London), Europe (Paris), Europe (Stockholm), and Asia Pacific (Tokyo).
  • The trigger prompt is capped at 2,048 characters when invoked through API/CLI.

Verify latest limitations against the GuardDuty investigation documentation before committing to a design.

Conclusion

The investigation agent shifts GuardDuty from a detection surface to a triage surface. For teams whose incident response cost is dominated by evidence correlation rather than detection, that is the interesting move. Preview status means the mechanics — Regions, quotas, latency, retention — need to be validated against your environment before it lands in a runbook, but the shape of the workflow is clear enough to start piloting against a defined scope, most sensibly a single administrator account or a bounded set of high-signal findings. Details and getting-started guidance are on the AWS Security Blog and in the GuardDuty documentation.

AWS CloudFormation IaC Generator!

AWS has recently introduced a Console-to-Code functionality, allowing users to automatically generate Infrastructure as Code (IaC) templates based on actions performed in the EC2 console. Additionally, AWS offers the CloudFormation IaC Generator, a compact tool embedded in the AWS CloudFormation console. This tool facilitates the creation of CloudFormation templates for pre-existing resources within your account. In the following post, we will walk through this tool and step-by-step instructions on how to use it.

Exploring AWS CloudFormation IaC Generator

What is the IaC generator?

The AWS CloudFormation IaC generator lets you generate a template for AWS resources that are already provisioned in your account and not being managed by CloudFormation. It does makes sense to exclude resources managed by CloudFormation since you already have a template for them!

Firstly, initiate a scan of your account under the IaC generator console to provide the tool with a comprehensive list of resources not governed by CloudFormation. There are a few quota limits on these scans which can be referred here.

Upon completion of the scan, the tool displays a list of resources that are not under CloudFormation management. Begin creating the template by selecting these resources, and the tool will then generate the template in either YAML or JSON format.

The powerful IaC generator capabilities of CloudFormation can also be accessed via the AWS CLI, making it a compelling choice for streamlined and efficient automation.

How to use the IaC generator?

IaC generator console
  • If you are using it for the first time, you might want to hit the Start a new scan button for running the first resources scan of this tool. This scan will identify all the AWS resources in your account that are not managed by CloudFormation.
  • Click on Create template button.
  • On a create wizard, provide the template details.
Template details
  • We are choosing to create a template from scratch. If you want to add a resource in exsiting CloudFormation stack then choose ‘Upadte the template for an existing stack‘. Make an appropriate choice for deletion and update replace policies.
  • On a next screen, choose resources to be included in the IaC template.
Adding scanned resources
  • If the resource you are looking for is not in the list, probably you need to initiate the new scan since your scan inventory might be the old one.
  • Click on Next button and choose related resources if any.
Related resources
  • The tool gathers the list of dependent or related resources from the resource you chose in the last step. Since we selected S3 bucket with no external dependency like KMS key, etc. we are not having any related resource.
  • Click on Next button for the final Review screen of the wizard.
Review
  • Review the selections and click Create template button.
IaC template is ready!
  • The teamplate will be genrated. You will have option to choose YAML or JSON format. You can copy or download it as well. Or you can import it into a CloudFormation Stack by clicking Import to stack button.
  • There is also AWS CDK application command in last tab AWS CDK

Importing the AWS resources in to the CloudFormation stack

It is always advisable to manage AWS resources through IaC templates, as this approach enhance resource management and minimizes the cloud clutter. One common challenge in the IaC journey is incorporating manually created existing resources into IaC. The IaC generator proves valuable in this scenario by assisting in the creation of IaC templates for your resources, facilitating a seamless transition.

Using IaC generator, you can generate the IaC template of existing resources that are not managed by Cloudformation. Once the template is generated, it also offers an option to import it in to the stack. Select that option (the last screesnhot in above section) and it will kickstart Cloudfomation import stack wizard.

Review all the information on the console, and then proceed to initiate the creation of a new stack that will import the chosen resources. I won’t go into a detailed, step-by-step procedure here, as it follows the standard CloudFormation stack process.

The CloudFormation stack will be created and you can see the selected resource is now imported and managed by CloudFormation.

Import resource completed.

This is a convenient method to scan for resources not governed by CloudFormation and subsequently import them into a CloudFormation stack, thereby fostering the adoption of Infrastructure as Code practices within your account and organization.

Conclusion

The IaC generator from AWS is a commendable initiative aimed at assisting customers in achieving 100% compliance with Infrastructure as Code for their infrastructure. It provides a seamless experience, effortlessly identifying non-IaC resources and smoothly importing them into CloudFormation stacks. Furthermore, it expedites the adoption of IaC by automatically generating code templates for you.

Exploring CloudFormation Git Sync!

In late Nov 2023, amazon announced the new CloudFormation Git sync feature. Let’s explore this new feature; how it works, how it impacts CD patterns of Infrastructure as Code (IaC), etc.

CloudFromation Git Sync Feature!

What is the CloudFormation Git sync?

Recently announced CloudFormation Git sync feature lets customers deploy and sync the CloudFormation IaC code directly from remote Git repositories. This will be a game changer in the future as this feature might empower customers to omit the Continuous Deployment tools like Jenkins, GitHub Actions, etc. altogether and hence their maintenance.

In summary, the customer is required to establish a GitHub Connection with AWS and subsequently generate a CloudFormation stack using the relevant IaC template repository information. Once the stack is set up, CloudFormation continually monitors the template files in the remote Git repository. Any new commits in the remote repo, trigger the automatic deployment of the corresponding changes to AWS.

Pre-requisite for CloudFormation Git sync

  • A Git repository with a valid CloudFormation IaC template
  • A GitHub Connector configured for the target AWS account
  • IAM role for Git Sync operations. It should have –
    • Access IAM policy
    • Trust policy

IAM policy

For tighter security control, one can scope down the IAM policy for certain CloudFormation Stacks using a resource block in the SyncToCloudFormation statement.

{
    "Version": "2012-10-17",
    "Statement": [
        {
            "Sid": "SyncToCloudFormation",
            "Effect": "Allow",
            "Action": [
                "cloudformation:CreateChangeSet",
                "cloudformation:DeleteChangeSet",
                "cloudformation:DescribeChangeSet",
                "cloudformation:DescribeStackEvents",
                "cloudformation:DescribeStacks",
                "cloudformation:ExecuteChangeSet",
                "cloudformation:GetTemplate",
                "cloudformation:ListChangeSets",
                "cloudformation:ListStacks",
                "cloudformation:ValidateTemplate"
            ]
        },
        {
            "Sid": "PolicyForManagedRules",
            "Effect": "Allow",
            "Action": [
                "events:PutRule",
                "events:PutTargets"
            ],
            "Resource": "*",
            "Condition": {
                "StringEquals": {
                    "events:ManagedBy": [
                        "cloudformation.sync.codeconnections.amazonaws.com"
                    ]
                }
            }
        },
        {
            "Sid": "PolicyForDescribingRule",
            "Effect": "Allow",
            "Action": "events:DescribeRule",
            "Resource": "*"
        }
    ]
}

Trust policy

{
    "Version": "2012-10-17",
    "Statement": [
        {
            "Sid": "TrustPolicy",
            "Effect": "Allow",
            "Principal": {
                "Service": "cloudformation.sync.codeconnections.amazonaws.com"
            },
            "Action": "sts:AssumeRole"
        }
    ]
}

How to create a stack using CloudFormation Git Sync?

Let’s look at the step-by-step procedure to deploy a new CloudFormation stack using Git Sync.

Environment setup considered here –

  • An AWS account configured with GitHub Connection in the Developer Tools Console.
  • A Private GitHub repository cfn-git-sync-poc that hosts a valid CloudFormation template at cloudformation/s3-stack.yaml
  • An IAM role was cfn-github-role created on the target AWS account with above stated policies.

Now, it’s time to get our hands dirty!

  • Log in to the AWS CloudFormation console. Click on the Create stack dropdown button and choose With new resources (standard)
  • On a Create stack page, select Template is ready and Sync from Git
Create stack using Git
  • Start providing the stack details like the stack name of your choice and select automatic Deployment file creation. If you wish to create a deployment file, please refer to this file format details.
Stack details
  • Then, specify the Git repository information. Ensure that you have a configured and active GitHub connection to fill in the fields in this segment. Choose the repository containing the Infrastructure as Code (IaC), specify the deployment branch, and designate a Deployment file path where AWS will store the newly committed deployment file. Lastly, furnish the IAM role details that will be utilized for executing Git Sync operations.
Repository details
  • Lastly, enter the file path for the CloudFormation IaC template inside the remote Git repo and define the parameters that are declared in the template. These details will be used to build the Deployment file.
Template and parameter details
  • Click the Next button and you will enter the Stack options page.
  • Stack options are the same as any other CloudFormation stack hence we will not discuss them here.
  • After verifying/modifying Stack options click Next button on the page.
  • Now, you will enter the review page where you can see the Deployment file constructed using the details provided and it will be committed to the remote Git repo on defined location
Deployment file!
  • Review the rest of the configurations and click the Submit button.
  • Now, CloudFormation will commit and push the Deployment file to the remote Git repo by raising a Pull Request (PR). The message will be flagged on the page. Meanwhile, since the Deployment file is not found in the remote repo, the Provisioning status will be marked as Failed. Once PR is approved, Deployment file will be available in the remote repo.
The First deploy using CloudFormation Git Sync
  • Head over to GitHub and you should see a PR raised by Amazon to commit the deployment file into the remote repo.
PR raised by AWS Connector
Deployment file creation by AWS Connector in PR
  • Review, approve, and merge the PR.
  • Once PR is merged the code modification is detected by CloudFormation and it starts provisioning the stack.
Stack provisioning started
  • Once all defined resources are created, stack creation will complete and CloudFormation keep monitoring the Git repository for any new changes.
The Stack is deployed successfully!

In multiple environments such as development, testing, staging, and production, it’s possible to utilize distinct Stack Deployment files while leveraging a single CloudFormation IaC template file. These varied Deployment files can be organized into separate folders within the same repository for better segregation. By selecting the appropriate deployment file based on the environment where the CloudFormation stack is being established, the process becomes more streamlined. Something like –

cloudformation
├── dev
│   └── deployment.yaml
├── test
│   └── deployment.yaml
├── staging
│   └── deployment.yaml
├── production
│   └── deployment.yaml
└── template.yaml

By selecting the appropriate deployment file based on the environment where the CloudFormation stack is being established, the process becomes more streamlined. I anticipate that the Git Sync feature will evolve with additional capabilities in the future, potentially prompting customers to reconsider the necessity of separate Continuous Deployment (CD) software.

What do you think about this feature?

What are your thoughts on the CloudFormation Git Sync feature? Could it potentially revolutionize the game? Will it make several Continuous Deployment tools obsolete? It feels like an ArgoCD for Kubernetes, operating in a remarkably similar manner. For sure, it may not yet offer extensive control over commit-wide deployments, but the potential for future enhancements is exciting. This feature appears to transform the Infrastructure as Code (IaC) landscape for AWS customers, possibly luring some back from alternative IaC platforms. Witnessing its development and utilization in enterprise productions is going to be exciting!