Learn how to disable SELinux in most of the Linux distro. Understand what is SELinux; why and when you require to disable it.

You may have come across many app/tools or utility configurations on Linux like FTP when its stated to disable SELinux. You do it and your config runs smoothly. Have you ever wondered what is this SELinux thing? We are going to discuss this in this post!
SELinux is a short form of Security-Enhanced Linux. It’s a set of modules that implement access control policies in the kernel. To disable all this policy enforcement, we disable SELinux. These access control policies might interfere and won’t let your app/utility etc work properly. This is why we see disabling SELinux steps in configurations. Vendors like Red Hat strongly recommends using ‘Permissive mode’ rather than completely disabling SELinux.
SELinux exists to secure your server! Do not disable it unless you have a good reason or you know what you are doing.
SELinux modes:
There are three modes defined in SELinux config files.
- Enforcing: Always enforce policies
- Permissive: Prints warning messages rather than actually enforcing policies
- Disabled: All SELinux policies disabled.
Its always to go with permissive mode if you are troubleshooting some system/app/utility behavior. So that it will give you a proper picture if SELinux really coming in your way and if you should permanently disable it or not.
Current SELinux mode can be checked using below command :
# getenforce
Permissive
Here SELinux is running in permissive mode.
How to disable SELinux temporarily :
Disabling SELinux permanently using the config file method (explained below) needs a reboot. If you want to avoid downtime then you can turn it into permissive mode temporarily using below method :
# echo 0 > /selinux/enforce
OR
# setenforce 0
Setting enforce file with value 0 makes it permissive. Turning it to 1 makes SELinux enforcing.
How to disable SELinux permanently:
SELinux has its own configuration file located at /etc/selinux/config. Here you can state SELINUX=disabled. But this file change needs a reboot to take effect. Here you can even choose permissive mode we talked about earlier.
# cat /etc/selinux/config

# This file controls the state of SELinux on the system.
# SELINUX= can take one of these three values:
#     enforcing - SELinux security policy is enforced.
#     permissive - SELinux prints warnings instead of enforcing.
#     disabled - No SELinux policy is loaded.
SELINUX=enforcing
# SELINUXTYPE= can take one of these two values:
#     targeted - Targeted processes are protected,
#     mls - Multi Level Security protection.
SELINUXTYPE=targeted
Save file changes and reboot the system. Once rebooted you can see SELinux status using getenforce command.
This method works on RHEL, CentOS, Fedora, Ubuntu.
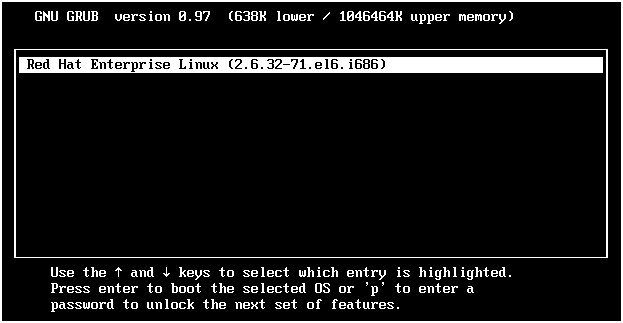
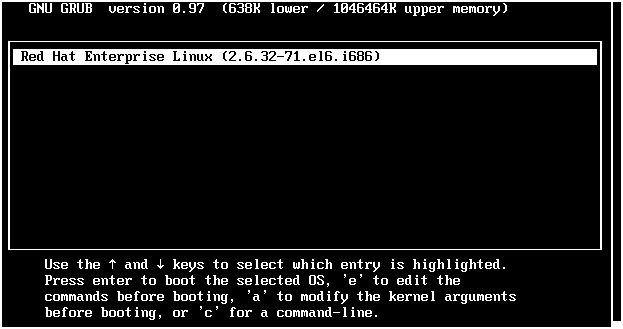
SELinux mode selection from GRUB:
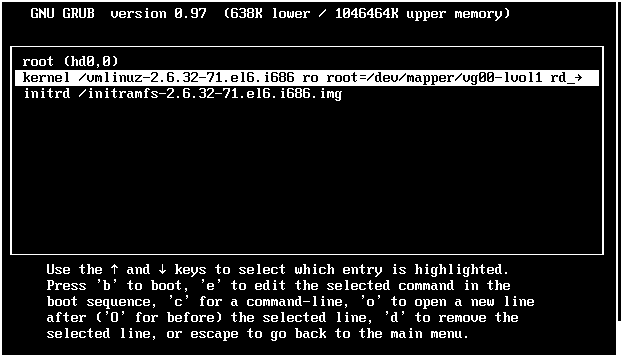
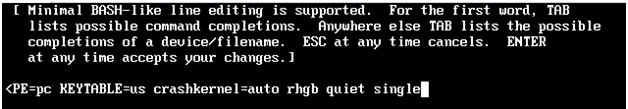
You can even decide which mode SELinux starts with system boot. Edit /boot/grub/grub.conf file and appending entry selinux=0 or selinux=1 in kernel line like below:
# cat /boot/grub/grub.conf
---- output clipped -----
splashimage=(hd0)/boot/grub/splash.xpm.gz
hiddenmenu
title Red Hat Enterprise Linux (2.6.32-431.29.2.el6.x86_64)
        root (hd0)
        kernel /boot/vmlinuz-2.6.32-431.29.2.el6.x86_64 ro root=LABEL=/ rhgb quite selinux=0
        initrd /boot/initramfs-2.6.32-431.29.2.el6.x86_64.img
Disabling SELinux for specific service:
Disabling SELinux for specific services also possible. So you can keep it in enforcing mode and only disable for your required services. You need to use setsebool command and feed it with service name nad required value like below.
# setsebool httpd_disable_trans 0
This sets its permissive mode for httpd services. Make a note that, you need to restart related service after disabling/enabling SELinux for it.