Learn how to create access keys in AWS with screenshots. Also see how to make access key active, inactive, and delete.
Access keys in AWS
Security is a top priority when you are using cloud services. Username/password is a primitive form of security we used for account security. Since technology has evolved and automation took over the day-to-day activities, manual work has been transformed into API calls. Many things get their work done by making API calls to respected services.
In the cloud, once service gets connected to another service with API Calls. API calls also need to get authenticated across services so that your cloud infra stays secure. For that AWS uses access keys that can be supplied to source service to get it authenticated at destination service and complete API calls. Now, the question is where are my access keys in AWS? Where to create access keys in AWS? In this article we will see how to create, make active, make inactive, and delete access keys in AWS.
How to create access keys in AWS?
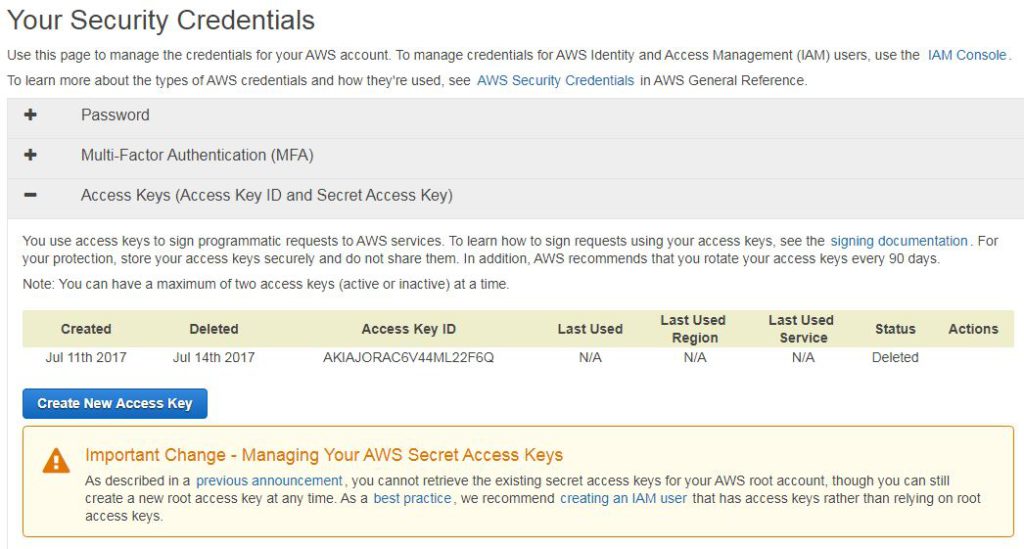
Login to your AWS console and navigate to this IAM dashboard part. This page helps you to manage your security credentials like password, MFA, access keys, certificates, etc. Expand ‘Access Keys (Access Key ID and Secret Access Key)‘ and you will see space to create new access keys like below.
Access keys dashboard
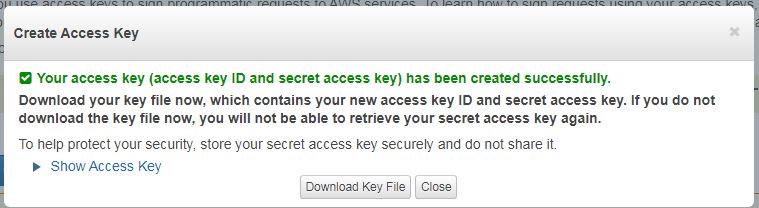
Here, click on the button ‘Create New Access Key‘. Once clicked your access key pair will be generated automatically. Each access key pair consist of access key ID and secret access key. Access key ID will be visible to you in your account all the time (like you can see it in the above screenshot). But, the secret access key is visible only time of the creation for security purposes. You also have the choice to download a secret access key file. But apart from this file and time of creation you won’t be able to see/retrieve this key. It’s your duty to keep it safe. After hitting create keys button you will see below screen :
Create access keys
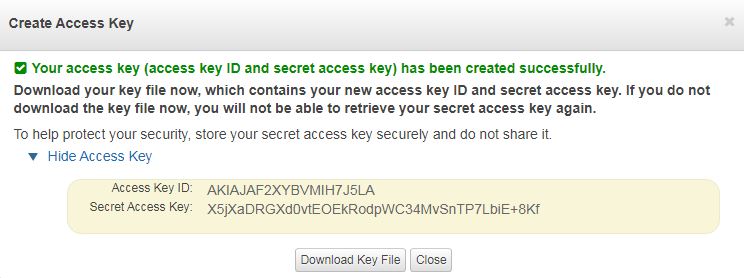
Both keys can be reveled to copy and save, by clicking the‘Show Access Key‘ link in the above dialogue box. Keys will be shown to you in plain text like below :
Display access keys
You can also opt to save this key pair. Click Download Key File button. Your key pair will be downloaded as a rootkey.csv file. Inside the CSV file, the key pair is in plain text format as stated below.
Your existing key pairs you must be used in some services. But sometimes they are sitting idle there since you haven’t used them. Sometimes, you need to stop the access to service which was using key pair. In such cases, it’s best to make that key pair inactive. So that access to service using that key pair will be paused. This might be useful in troubleshooting as well.
To make access key inactive visit the same security console in your AWS account and list all existing key pairs by expanding ‘Access Keys (Access Key ID and Secret Access Key)‘. Identify your required key and click the‘Make Inactive‘ link against it in the last column named ‘Actions’.
The key status will turn inactive and all its authorizations will be paused. It can be verified in a column named status against it.
How to make access key active?
For all keys which are inactive in the state will have a ‘Make Active’ link against them in the last ‘Actions’ column. You have to click it to make them active again.
How to delete access key?
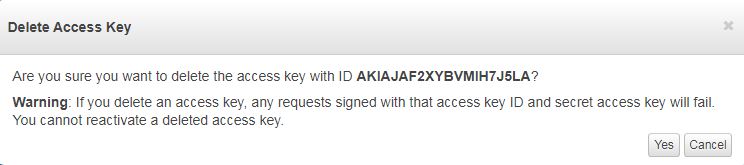
Under Actions column you will also see Delete link besides active/inactive one. This is to be used when you want to delete access key.
Delete access key
It will confirm you like the above screenshot before deleting. Deleting key will still keep it in dashboard listing with status as ‘delete’ but you won’t be able to use it in the future.
# apt-get install autotools-dev

Reading package lists... Done
Building dependency tree
Reading state information... Done
The following NEW packages will be installed:
  autotools-dev
0 upgraded, 1 newly installed, 0 to remove and 35 not upgraded.
Need to get 39.8 kB of archives.
After this operation, 155 kB of additional disk space will be used.
Get:1 http://ap-south-1.ec2.archive.ubuntu.com/ubuntu xenial/main amd64 autotools-dev all 20150820.1 [39.8 kB]
Fetched 39.8 kB in 0s (104 kB/s)
Selecting previously unselected package autotools-dev.
(Reading database ... 56705 files and directories currently installed.)
Preparing to unpack .../autotools-dev_20150820.1_all.deb ...
Unpacking autotools-dev (20150820.1) ...
Processing triggers for man-db (2.7.5-1) ...
Setting up autotools-dev (20150820.1) ...
Once completed, proceed with installing automake package.
# apt-get install automake

Reading package lists... Done
Building dependency tree
Reading state information... Done
The following additional packages will be installed:
  autoconf m4
Suggested packages:
  autoconf-archive gnu-standards autoconf-doc libtool gettext
The following NEW packages will be installed:
  autoconf automake m4
0 upgraded, 3 newly installed, 0 to remove and 35 not upgraded.
Need to get 1,025 kB of archives.
After this operation, 3,781 kB of additional disk space will be used.
Do you want to continue? [Y/n] y
Get:1 http://ap-south-1.ec2.archive.ubuntu.com/ubuntu xenial/main amd64 m4 amd64 1.4.17-5 [195 kB]
Get:2 http://ap-south-1.ec2.archive.ubuntu.com/ubuntu xenial/main amd64 autoconf all 2.69-9 [321 kB]
Get:3 http://ap-south-1.ec2.archive.ubuntu.com/ubuntu xenial/main amd64 automake all 1:1.15-4ubuntu1 [510 kB]
Fetched 1,025 kB in 1s (920 kB/s)
Selecting previously unselected package m4.
(Reading database ... 56719 files and directories currently installed.)
Preparing to unpack .../archives/m4_1.4.17-5_amd64.deb ...
Unpacking m4 (1.4.17-5) ...
Selecting previously unselected package autoconf.
Preparing to unpack .../autoconf_2.69-9_all.deb ...
Unpacking autoconf (2.69-9) ...
Selecting previously unselected package automake.
Preparing to unpack .../automake_1%3a1.15-4ubuntu1_all.deb ...
Unpacking automake (1:1.15-4ubuntu1) ...
Processing triggers for install-info (6.1.0.dfsg.1-5) ...
Processing triggers for man-db (2.7.5-1) ...
Setting up m4 (1.4.17-5) ...
Setting up autoconf (2.69-9) ...
Setting up automake (1:1.15-4ubuntu1) ...
update-alternatives: using /usr/bin/automake-1.15 to provide /usr/bin/automake (automake) in auto mode
This automake package will get you through success! After installing both of them I tried running script again and it was successful.
Learn to mount an S3 bucket in RHEL, Ubuntu, CentOS Linux server. Understand how to debug issues while mounting an S3 bucket.
Mount S3 bucket in Linux
In this article we will walk through the process by which you can mount an S3 bucket on the Linux server. S3 bucket is a storage container of S3 (simple storage service) AWS service. As all traditional data centers are moving to cloud computing, it is necessary to know how to interconnect cloud and traditional services. Let’s dive into the process to mount an S3 bucket in RHEL, Ubuntu, CentOS Linux. The complete process can be done in below 3 steps:
Install fuse and s3fs packages
Configure access keys of your AWS account
Mount S3 bucket
For this tutorial, we are assuming you have an S3 bucket ready in your AWS account with a proper permission setup. If not, follow this tutorial to create an S3 bucket in AWS.
Install fuse and s3fs packages
These packages can be found here: fuse & s3fs. You have to download them on the Linux server with tools like wget and compile them. Make sure you have their dependencies installed before you try to compile them.
Dependencies are :
for RedHat based : automakegccgcc-c++gitlibcurl-devellibxml2-develmakeopenssl-develmailcapcurl-devellibstdc++-devel
for Debian based : automakeautotools-devg++gitlibcurl4-gnutls-devlibfuse-devlibssl-devlibxml2-devmakepkg-config
Install all these packages and follow the below steps to configure fuse and s3fs. Make sure there is no package named fuse of s3fs exist in the server before you proceed. This is to avoid conflicts in installation.
Fuse installation –
Use the below commands. Use the latest Fuse download link used in wget command. You can obtain it from Github here.
# cd /usr/src/
# wget https://github.com/libfuse/libfuse/releases/download/fuse-3.1.0/fuse-3.1.0.tar.gz
# tar -zxf fuse-3.1.0.tar.gz
# cd fuse-3.1.0
# ./configure -prefix=/usr/local
# make && make install
# export PKG_CONFIG_PATH=/usr/local/lib/pkgconfig
# ldconfig
# modprobe fuse
The fuse installation output is below for your reference. Click and expand if you want to view it.
# cd /usr/src/
# wget https://github.com/libfuse/libfuse/releases/download/fuse-3.1.0/fuse-3.1.0.tar.gz
--2017-07-11 05:19:36-- https://github.com/libfuse/libfuse/releases/download/fuse-3.1.0/fuse-3.1.0.tar.gz
Resolving github.com (github.com)... 192.30.253.112, 192.30.253.113
Connecting to github.com (github.com)|192.30.253.112|:443... connected.
HTTP request sent, awaiting response... 302 Found
Location: https://github-production-release-asset-2e65be.s3.amazonaws.com/48296177/00b4f6e4-63dc-11e7-938f-c32c894af199 [following]
--2017-07-11 05:19:37-- https://github-production-release-asset-2e65be.s3.amazonaws.com/48296177/00b4f6e4-63dc-11e7-938f-c32c894af199
Resolving github-production-release-asset-2e65be.s3.amazonaws.com (github-production-release-asset-2e65be.s3.amazonaws.com)... 52.216.230.243
Connecting to github-production-release-asset-2e65be.s3.amazonaws.com (github-production-release-asset-2e65be.s3.amazonaws.com)|52.216.230.243|:443... connected.
HTTP request sent, awaiting response... 200 OK
Length: 809470 (790K) [application/octet-stream]
Saving to: ‘fuse-3.1.0.tar.gz’
fuse-3.1.0.tar.gz 100%[============================================================================>] 790.50K 479KB/s in 1.7s
2017-07-11 05:19:40 (479 KB/s) - ‘fuse-3.1.0.tar.gz’ saved [809470/809470]
# tar -zxf fuse-3.1.0.tar.gz
# cd fuse-3.1.0
# ./configure -prefix=/usr/local
checking build system type... x86_64-pc-linux-gnu
checking host system type... x86_64-pc-linux-gnu
checking target system type... x86_64-pc-linux-gnu
checking for a BSD-compatible install... /usr/bin/install -c
checking whether build environment is sane... yes
checking for a thread-safe mkdir -p... /bin/mkdir -p
checking for gawk... gawk
checking whether make sets $(MAKE)... yes
checking whether make supports nested variables... yes
checking whether make supports nested variables... (cached) yes
checking how to print strings... printf
checking for style of include used by make... GNU
checking for gcc... gcc
checking whether the C compiler works... yes
checking for C compiler default output file name... a.out
checking for suffix of executables...
checking whether we are cross compiling... no
checking for suffix of object files... o
checking whether we are using the GNU C compiler... yes
checking whether gcc accepts -g... yes
checking for gcc option to accept ISO C89... none needed
checking whether gcc understands -c and -o together... yes
checking dependency style of gcc... gcc3
checking for a sed that does not truncate output... /bin/sed
checking for grep that handles long lines and -e... /bin/grep
checking for egrep... /bin/grep -E
checking for fgrep... /bin/grep -F
checking for ld used by gcc... /usr/bin/ld
checking if the linker (/usr/bin/ld) is GNU ld... yes
checking for BSD- or MS-compatible name lister (nm)... /usr/bin/nm -B
checking the name lister (/usr/bin/nm -B) interface... BSD nm
checking whether ln -s works... yes
checking the maximum length of command line arguments... 1572864
checking how to convert x86_64-pc-linux-gnu file names to x86_64-pc-linux-gnu format... func_convert_file_noop
checking how to convert x86_64-pc-linux-gnu file names to toolchain format... func_convert_file_noop
checking for /usr/bin/ld option to reload object files... -r
checking for objdump... objdump
checking how to recognize dependent libraries... pass_all
checking for dlltool... no
checking how to associate runtime and link libraries... printf %s\n
checking for ar... ar
checking for archiver @FILE support... @
checking for strip... strip
checking for ranlib... ranlib
checking command to parse /usr/bin/nm -B output from gcc object... ok
checking for sysroot... no
checking for a working dd... /bin/dd
checking how to truncate binary pipes... /bin/dd bs=4096 count=1
checking for mt... mt
checking if mt is a manifest tool... no
checking how to run the C preprocessor... gcc -E
checking for ANSI C header files... yes
checking for sys/types.h... yes
checking for sys/stat.h... yes
checking for stdlib.h... yes
checking for string.h... yes
checking for memory.h... yes
checking for strings.h... yes
checking for inttypes.h... yes
checking for stdint.h... yes
checking for unistd.h... yes
checking for dlfcn.h... yes
checking for objdir... .libs
checking if gcc supports -fno-rtti -fno-exceptions... no
checking for gcc option to produce PIC... -fPIC -DPIC
checking if gcc PIC flag -fPIC -DPIC works... yes
checking if gcc static flag -static works... yes
checking if gcc supports -c -o file.o... yes
checking if gcc supports -c -o file.o... (cached) yes
checking whether the gcc linker (/usr/bin/ld -m elf_x86_64) supports shared libraries... yes
checking whether -lc should be explicitly linked in... no
checking dynamic linker characteristics... GNU/Linux ld.so
checking how to hardcode library paths into programs... immediate
checking whether stripping libraries is possible... yes
checking if libtool supports shared libraries... yes
checking whether to build shared libraries... yes
checking whether to build static libraries... yes
checking for gcc option to accept ISO C99... none needed
checking for gcc option to accept ISO Standard C... (cached) none needed
checking for special C compiler options needed for large files... no
checking for _FILE_OFFSET_BITS value needed for large files... no
checking for fork... yes
checking for setxattr... yes
checking for fdatasync... yes
checking for splice... yes
checking for vmsplice... yes
checking for utimensat... yes
checking for pipe2... yes
checking for posix_fallocate... yes
checking for fstatat... yes
checking for openat... yes
checking for readlinkat... yes
checking for struct stat.st_atim... yes
checking for struct stat.st_atimespec... no
checking for library containing dlopen... -ldl
checking for library containing clock_gettime... none required
checking for ulockmgr_op in -lulockmgr... no
checking for ld used by gcc... /usr/bin/ld -m elf_x86_64
checking if the linker (/usr/bin/ld -m elf_x86_64) is GNU ld... yes
checking for shared library run path origin... done
checking for iconv... yes
checking for working iconv... yes
checking for iconv declaration...
extern size_t iconv (iconv_t cd, char * *inbuf, size_t *inbytesleft, char * *outbuf, size_t *outbytesleft);
configure: MOUNT_FUSE_PATH env var not set, using default ${sbindir}
configure: UDEV_RULES_PATH env var not set, using default ${libdir}/udev/rules.d
configure: INIT_D_PATH env var not set, using default ${sysconfdir}/init.d
checking if umount supports --fake --no-canonicalize... yes
checking that generated files are newer than configure... done
configure: creating ./config.status
config.status: creating fuse3.pc
config.status: creating Makefile
config.status: creating lib/Makefile
config.status: creating util/Makefile
config.status: creating example/Makefile
config.status: creating include/Makefile
config.status: creating doc/Makefile
config.status: creating test/Makefile
config.status: creating include/config.h
config.status: executing depfiles commands
config.status: executing libtool commands
# make && make install
Making all in include
make[1]: Entering directory '/usr/src/fuse-3.1.0/include'
make all-am
make[2]: Entering directory '/usr/src/fuse-3.1.0/include'
make[2]: Nothing to be done for 'all-am'.
make[2]: Leaving directory '/usr/src/fuse-3.1.0/include'
make[1]: Leaving directory '/usr/src/fuse-3.1.0/include'
Making all in lib
make[1]: Entering directory '/usr/src/fuse-3.1.0/lib'
CC fuse.lo
CC fuse_loop.lo
CC fuse_loop_mt.lo
CC fuse_lowlevel.lo
CC fuse_opt.lo
CC fuse_signals.lo
CC buffer.lo
CC cuse_lowlevel.lo
CC helper.lo
helper.c: In function ‘fuse_daemonize’:
helper.c:226:4: warning: ignoring return value of ‘read’, declared with attribute warn_unused_result [-Wunused-result]
(void) read(waiter[0], &completed, sizeof(completed));
^
helper.c:235:3: warning: ignoring return value of ‘chdir’, declared with attribute warn_unused_result [-Wunused-result]
(void) chdir("/");
^
helper.c:248:3: warning: ignoring return value of ‘write’, declared with attribute warn_unused_result [-Wunused-result]
(void) write(waiter[1], &completed, sizeof(completed));
^
helper.c:252:3: warning: ignoring return value of ‘chdir’, declared with attribute warn_unused_result [-Wunused-result]
(void) chdir("/");
^
CC modules/subdir.lo
CC modules/iconv.lo
CC mount.lo
CC mount_util.lo
mount_util.c: In function ‘mtab_needs_update’:
mount_util.c:68:4: warning: ignoring return value of ‘setreuid’, declared with attribute warn_unused_result [-Wunused-result]
setreuid(0, -1);
^
mount_util.c:73:4: warning: ignoring return value of ‘setreuid’, declared with attribute warn_unused_result [-Wunused-result]
setreuid(ruid, -1);
^
CCLD libfuse3.la
ar: `u' modifier ignored since `D' is the default (see `U')
make[1]: Leaving directory '/usr/src/fuse-3.1.0/lib'
Making all in util
make[1]: Entering directory '/usr/src/fuse-3.1.0/util'
make all-am
make[2]: Entering directory '/usr/src/fuse-3.1.0/util'
CC fusermount3-fusermount.o
CC fusermount3-mount_util.o
mount_util.c: In function ‘mtab_needs_update’:
mount_util.c:68:4: warning: ignoring return value of ‘setreuid’, declared with attribute warn_unused_result [-Wunused-result]
setreuid(0, -1);
^
mount_util.c:73:4: warning: ignoring return value of ‘setreuid’, declared with attribute warn_unused_result [-Wunused-result]
setreuid(ruid, -1);
^
CCLD fusermount3
CC mount.fuse.o
CCLD mount.fuse3
make[2]: Leaving directory '/usr/src/fuse-3.1.0/util'
make[1]: Leaving directory '/usr/src/fuse-3.1.0/util'
Making all in example
make[1]: Entering directory '/usr/src/fuse-3.1.0/example'
CC passthrough.o
CCLD passthrough
CC passthrough_fh.o
CCLD passthrough_fh
CC null.o
CCLD null
CC hello.o
CCLD hello
CC hello_ll.o
CCLD hello_ll
CC ioctl.o
CCLD ioctl
CC ioctl_client-ioctl_client.o
CCLD ioctl_client
CC poll.o
CCLD poll
CC poll_client-poll_client.o
CCLD poll_client
CC passthrough_ll.o
CCLD passthrough_ll
CC notify_inval_inode.o
CCLD notify_inval_inode
CC notify_store_retrieve.o
CCLD notify_store_retrieve
CC notify_inval_entry.o
CCLD notify_inval_entry
CC cuse.o
CCLD cuse
CC cuse_client.o
CCLD cuse_client
make[1]: Leaving directory '/usr/src/fuse-3.1.0/example'
Making all in test
make[1]: Entering directory '/usr/src/fuse-3.1.0/test'
CC test_syscalls.o
CCLD test_syscalls
CC test_write_cache.o
CCLD test_write_cache
CC test_setattr.o
CCLD test_setattr
make[1]: Leaving directory '/usr/src/fuse-3.1.0/test'
Making all in doc
make[1]: Entering directory '/usr/src/fuse-3.1.0/doc'
make[1]: Nothing to be done for 'all'.
make[1]: Leaving directory '/usr/src/fuse-3.1.0/doc'
make[1]: Entering directory '/usr/src/fuse-3.1.0'
make[1]: Nothing to be done for 'all-am'.
make[1]: Leaving directory '/usr/src/fuse-3.1.0'
Making install in include
make[1]: Entering directory '/usr/src/fuse-3.1.0/include'
make[2]: Entering directory '/usr/src/fuse-3.1.0/include'
make[2]: Nothing to be done for 'install-exec-am'.
/bin/mkdir -p '/usr/local/include/fuse3'
/usr/bin/install -c -m 644 fuse.h fuse_common.h fuse_lowlevel.h fuse_opt.h cuse_lowlevel.h '/usr/local/include/fuse3'
make[2]: Leaving directory '/usr/src/fuse-3.1.0/include'
make[1]: Leaving directory '/usr/src/fuse-3.1.0/include'
Making install in lib
make[1]: Entering directory '/usr/src/fuse-3.1.0/lib'
make[2]: Entering directory '/usr/src/fuse-3.1.0/lib'
/bin/mkdir -p '/usr/local/lib'
/bin/bash ../libtool --mode=install /usr/bin/install -c libfuse3.la '/usr/local/lib'
libtool: install: /usr/bin/install -c .libs/libfuse3.so.3.1.0 /usr/local/lib/libfuse3.so.3.1.0
libtool: install: (cd /usr/local/lib && { ln -s -f libfuse3.so.3.1.0 libfuse3.so.3 || { rm -f libfuse3.so.3 && ln -s libfuse3.so.3.1.0 libfuse3.so.3; }; })
libtool: install: (cd /usr/local/lib && { ln -s -f libfuse3.so.3.1.0 libfuse3.so || { rm -f libfuse3.so && ln -s libfuse3.so.3.1.0 libfuse3.so; }; })
libtool: install: /usr/bin/install -c .libs/libfuse3.lai /usr/local/lib/libfuse3.la
libtool: install: /usr/bin/install -c .libs/libfuse3.a /usr/local/lib/libfuse3.a
libtool: install: chmod 644 /usr/local/lib/libfuse3.a
libtool: install: ranlib /usr/local/lib/libfuse3.a
libtool: finish: PATH="/usr/local/sbin:/usr/local/bin:/usr/sbin:/usr/bin:/sbin:/bin:/snap/bin:/sbin" ldconfig -n /usr/local/lib
----------------------------------------------------------------------
Libraries have been installed in:
/usr/local/lib
If you ever happen to want to link against installed libraries
in a given directory, LIBDIR, you must either use libtool, and
specify the full pathname of the library, or use the '-LLIBDIR'
flag during linking and do at least one of the following:
- add LIBDIR to the 'LD_LIBRARY_PATH' environment variable
during execution
- add LIBDIR to the 'LD_RUN_PATH' environment variable
during linking
- use the '-Wl,-rpath -Wl,LIBDIR' linker flag
- have your system administrator add LIBDIR to '/etc/ld.so.conf'
See any operating system documentation about shared libraries for
more information, such as the ld(1) and ld.so(8) manual pages.
----------------------------------------------------------------------
make[2]: Nothing to be done for 'install-data-am'.
make[2]: Leaving directory '/usr/src/fuse-3.1.0/lib'
make[1]: Leaving directory '/usr/src/fuse-3.1.0/lib'
Making install in util
make[1]: Entering directory '/usr/src/fuse-3.1.0/util'
make install-am
make[2]: Entering directory '/usr/src/fuse-3.1.0/util'
make[3]: Entering directory '/usr/src/fuse-3.1.0/util'
/bin/mkdir -p '/usr/local/bin'
/bin/bash ../libtool --mode=install /usr/bin/install -c fusermount3 '/usr/local/bin'
libtool: install: /usr/bin/install -c fusermount3 /usr/local/bin/fusermount3
/bin/mkdir -p /usr/local/sbin
/usr/bin/install -c ./mount.fuse3 /usr/local/sbin/mount.fuse3
/bin/mkdir -p /usr/local/etc/init.d
/usr/bin/install -c ./init_script /usr/local/etc/init.d/fuse3
/usr/sbin/update-rc.d fuse start 34 S . start 41 0 6 . || true
update-rc.d: error: unable to read /etc/init.d/fuse
make install-exec-hook
make[4]: Entering directory '/usr/src/fuse-3.1.0/util'
chmod u+s /usr/local/bin/fusermount3
make[4]: Leaving directory '/usr/src/fuse-3.1.0/util'
/bin/mkdir -p /usr/local/lib/udev/rules.d
/usr/bin/install -c -m 644 ./udev.rules /usr/local/lib/udev/rules.d/99-fuse3.rules
make[3]: Leaving directory '/usr/src/fuse-3.1.0/util'
make[2]: Leaving directory '/usr/src/fuse-3.1.0/util'
make[1]: Leaving directory '/usr/src/fuse-3.1.0/util'
Making install in example
make[1]: Entering directory '/usr/src/fuse-3.1.0/example'
make[2]: Entering directory '/usr/src/fuse-3.1.0/example'
make[2]: Nothing to be done for 'install-exec-am'.
make[2]: Nothing to be done for 'install-data-am'.
make[2]: Leaving directory '/usr/src/fuse-3.1.0/example'
make[1]: Leaving directory '/usr/src/fuse-3.1.0/example'
Making install in test
make[1]: Entering directory '/usr/src/fuse-3.1.0/test'
make[2]: Entering directory '/usr/src/fuse-3.1.0/test'
make[2]: Nothing to be done for 'install-exec-am'.
make[2]: Nothing to be done for 'install-data-am'.
make[2]: Leaving directory '/usr/src/fuse-3.1.0/test'
make[1]: Leaving directory '/usr/src/fuse-3.1.0/test'
Making install in doc
make[1]: Entering directory '/usr/src/fuse-3.1.0/doc'
make[2]: Entering directory '/usr/src/fuse-3.1.0/doc'
make[2]: Nothing to be done for 'install-exec-am'.
/bin/mkdir -p '/usr/local/share/man/man1'
/usr/bin/install -c -m 644 fusermount3.1 '/usr/local/share/man/man1'
/bin/mkdir -p '/usr/local/share/man/man8'
/usr/bin/install -c -m 644 mount.fuse.8 '/usr/local/share/man/man8'
make[2]: Leaving directory '/usr/src/fuse-3.1.0/doc'
make[1]: Leaving directory '/usr/src/fuse-3.1.0/doc'
make[1]: Entering directory '/usr/src/fuse-3.1.0'
make[2]: Entering directory '/usr/src/fuse-3.1.0'
make[2]: Nothing to be done for 'install-exec-am'.
/bin/mkdir -p '/usr/local/lib/pkgconfig'
/usr/bin/install -c -m 644 fuse3.pc '/usr/local/lib/pkgconfig'
make[2]: Leaving directory '/usr/src/fuse-3.1.0'
make[1]: Leaving directory '/usr/src/fuse-3.1.0'
# export PKG_CONFIG_PATH=/usr/local/lib/pkgconfig
# ldconfig
# modprobe fuse
s3fs installation-
Use the below commands. We are cloning git here so no need to check the latest release from GitHub website.
# git clone https://github.com/s3fs-fuse/s3fs-fuse.git
# cd s3fs-fuse
# ./autogen.sh
# ./configure
# make
# make install
s3fs installation output is below for your reference. Click and expand if you want to refer it.
# git clone https://github.com/s3fs-fuse/s3fs-fuse.git
Cloning into 's3fs-fuse'...
remote: Counting objects: 3552, done.
remote: Compressing objects: 100% (5/5), done.
remote: Total 3552 (delta 0), reused 2 (delta 0), pack-reused 3547
Receiving objects: 100% (3552/3552), 1.80 MiB | 1.15 MiB/s, done.
Resolving deltas: 100% (2426/2426), done.
Checking connectivity... done.
# cd s3fs-fuse
# ./autogen.sh
--- Make commit hash file -------
--- Finished commit hash file ---
--- Start autotools -------------
configure.ac:30: installing './compile'
configure.ac:26: installing './config.guess'
configure.ac:26: installing './config.sub'
configure.ac:27: installing './install-sh'
configure.ac:27: installing './missing'
src/Makefile.am: installing './depcomp'
parallel-tests: installing './test-driver'
--- Finished autotools ----------
# ./configure
checking build system type... x86_64-pc-linux-gnu
checking host system type... x86_64-pc-linux-gnu
checking target system type... x86_64-pc-linux-gnu
checking for a BSD-compatible install... /usr/bin/install -c
checking whether build environment is sane... yes
checking for a thread-safe mkdir -p... /bin/mkdir -p
checking for gawk... gawk
checking whether make sets $(MAKE)... yes
checking whether make supports nested variables... yes
checking for g++... g++
checking whether the C++ compiler works... yes
checking for C++ compiler default output file name... a.out
checking for suffix of executables...
checking whether we are cross compiling... no
checking for suffix of object files... o
checking whether we are using the GNU C++ compiler... yes
checking whether g++ accepts -g... yes
checking for style of include used by make... GNU
checking dependency style of g++... gcc3
checking for gcc... gcc
checking whether we are using the GNU C compiler... yes
checking whether gcc accepts -g... yes
checking for gcc option to accept ISO C89... none needed
checking whether gcc understands -c and -o together... yes
checking dependency style of gcc... gcc3
checking how to run the C preprocessor... gcc -E
checking for grep that handles long lines and -e... /bin/grep
checking for egrep... /bin/grep -E
checking for ANSI C header files... yes
checking for sys/types.h... yes
checking for sys/stat.h... yes
checking for stdlib.h... yes
checking for string.h... yes
checking for memory.h... yes
checking for strings.h... yes
checking for inttypes.h... yes
checking for stdint.h... yes
checking for unistd.h... yes
checking sys/xattr.h usability... yes
checking sys/xattr.h presence... yes
checking for sys/xattr.h... yes
checking attr/xattr.h usability... no
checking attr/xattr.h presence... no
checking for attr/xattr.h... no
checking sys/extattr.h usability... no
checking sys/extattr.h presence... no
checking for sys/extattr.h... no
checking s3fs build with nettle(GnuTLS)... no
checking s3fs build with OpenSSL... no
checking s3fs build with GnuTLS... no
checking s3fs build with NSS... no
checking for pkg-config... /usr/bin/pkg-config
checking pkg-config is at least version 0.9.0... yes
checking for common_lib_checking... yes
checking compile s3fs with... OpenSSL
checking for DEPS... yes
checking for malloc_trim... yes
checking for library containing clock_gettime... none required
checking for clock_gettime... yes
checking pthread mutex recursive... PTHREAD_MUTEX_RECURSIVE
checking for git... yes
checking for .git... yes
checking github short commit hash... b1fe419
checking that generated files are newer than configure... done
configure: creating ./config.status
config.status: creating Makefile
config.status: creating src/Makefile
config.status: creating test/Makefile
config.status: creating doc/Makefile
config.status: creating config.h
config.status: executing depfiles commands
# make
make all-recursive
make[1]: Entering directory '/usr/src/s3fs-fuse'
Making all in src
make[2]: Entering directory '/usr/src/s3fs-fuse/src'
g++ -DHAVE_CONFIG_H -I. -I.. -D_FILE_OFFSET_BITS=64 -I/usr/include/fuse -I/usr/include/libxml2 -g -O2 -Wall -D_FILE_OFFSET_BITS=64 -MT s3fs.o -MD -MP -MF .deps/s3fs.Tpo -c -o s3fs.o s3fs.cpp
mv -f .deps/s3fs.Tpo .deps/s3fs.Po
g++ -DHAVE_CONFIG_H -I. -I.. -D_FILE_OFFSET_BITS=64 -I/usr/include/fuse -I/usr/include/libxml2 -g -O2 -Wall -D_FILE_OFFSET_BITS=64 -MT curl.o -MD -MP -MF .deps/curl.Tpo -c -o curl.o curl.cpp
mv -f .deps/curl.Tpo .deps/curl.Po
g++ -DHAVE_CONFIG_H -I. -I.. -D_FILE_OFFSET_BITS=64 -I/usr/include/fuse -I/usr/include/libxml2 -g -O2 -Wall -D_FILE_OFFSET_BITS=64 -MT cache.o -MD -MP -MF .deps/cache.Tpo -c -o cache.o cache.cpp
mv -f .deps/cache.Tpo .deps/cache.Po
g++ -DHAVE_CONFIG_H -I. -I.. -D_FILE_OFFSET_BITS=64 -I/usr/include/fuse -I/usr/include/libxml2 -g -O2 -Wall -D_FILE_OFFSET_BITS=64 -MT string_util.o -MD -MP -MF .deps/string_util.Tpo -c -o string_util.o string_util.cpp
mv -f .deps/string_util.Tpo .deps/string_util.Po
g++ -DHAVE_CONFIG_H -I. -I.. -D_FILE_OFFSET_BITS=64 -I/usr/include/fuse -I/usr/include/libxml2 -g -O2 -Wall -D_FILE_OFFSET_BITS=64 -MT s3fs_util.o -MD -MP -MF .deps/s3fs_util.Tpo -c -o s3fs_util.o s3fs_util.cpp
mv -f .deps/s3fs_util.Tpo .deps/s3fs_util.Po
g++ -DHAVE_CONFIG_H -I. -I.. -D_FILE_OFFSET_BITS=64 -I/usr/include/fuse -I/usr/include/libxml2 -g -O2 -Wall -D_FILE_OFFSET_BITS=64 -MT fdcache.o -MD -MP -MF .deps/fdcache.Tpo -c -o fdcache.o fdcache.cpp
mv -f .deps/fdcache.Tpo .deps/fdcache.Po
g++ -DHAVE_CONFIG_H -I. -I.. -D_FILE_OFFSET_BITS=64 -I/usr/include/fuse -I/usr/include/libxml2 -g -O2 -Wall -D_FILE_OFFSET_BITS=64 -MT common_auth.o -MD -MP -MF .deps/common_auth.Tpo -c -o common_auth.o common_auth.cpp
mv -f .deps/common_auth.Tpo .deps/common_auth.Po
g++ -DHAVE_CONFIG_H -I. -I.. -D_FILE_OFFSET_BITS=64 -I/usr/include/fuse -I/usr/include/libxml2 -g -O2 -Wall -D_FILE_OFFSET_BITS=64 -MT addhead.o -MD -MP -MF .deps/addhead.Tpo -c -o addhead.o addhead.cpp
mv -f .deps/addhead.Tpo .deps/addhead.Po
g++ -DHAVE_CONFIG_H -I. -I.. -D_FILE_OFFSET_BITS=64 -I/usr/include/fuse -I/usr/include/libxml2 -g -O2 -Wall -D_FILE_OFFSET_BITS=64 -MT openssl_auth.o -MD -MP -MF .deps/openssl_auth.Tpo -c -o openssl_auth.o openssl_auth.cpp
mv -f .deps/openssl_auth.Tpo .deps/openssl_auth.Po
g++ -g -O2 -Wall -D_FILE_OFFSET_BITS=64 -o s3fs s3fs.o curl.o cache.o string_util.o s3fs_util.o fdcache.o common_auth.o addhead.o openssl_auth.o -lfuse -pthread -lcurl -lxml2 -lcrypto
fdcache.o: In function `FdEntity::OpenMirrorFile()':
/usr/src/s3fs-fuse/src/fdcache.cpp:761: warning: the use of `tmpnam' is dangerous, better use `mkstemp'
g++ -DHAVE_CONFIG_H -I. -I.. -D_FILE_OFFSET_BITS=64 -I/usr/include/fuse -I/usr/include/libxml2 -g -O2 -Wall -D_FILE_OFFSET_BITS=64 -MT test_string_util.o -MD -MP -MF .deps/test_string_util.Tpo -c -o test_string_util.o test_string_util.cpp
mv -f .deps/test_string_util.Tpo .deps/test_string_util.Po
g++ -g -O2 -Wall -D_FILE_OFFSET_BITS=64 -o test_string_util string_util.o test_string_util.o
make[2]: Leaving directory '/usr/src/s3fs-fuse/src'
Making all in test
make[2]: Entering directory '/usr/src/s3fs-fuse/test'
make[2]: Nothing to be done for 'all'.
make[2]: Leaving directory '/usr/src/s3fs-fuse/test'
Making all in doc
make[2]: Entering directory '/usr/src/s3fs-fuse/doc'
make[2]: Nothing to be done for 'all'.
make[2]: Leaving directory '/usr/src/s3fs-fuse/doc'
make[2]: Entering directory '/usr/src/s3fs-fuse'
make[2]: Nothing to be done for 'all-am'.
make[2]: Leaving directory '/usr/src/s3fs-fuse'
make[1]: Leaving directory '/usr/src/s3fs-fuse'
# make install
Making install in src
make[1]: Entering directory '/usr/src/s3fs-fuse/src'
make[2]: Entering directory '/usr/src/s3fs-fuse/src'
/bin/mkdir -p '/usr/local/bin'
/usr/bin/install -c s3fs '/usr/local/bin'
make[2]: Nothing to be done for 'install-data-am'.
make[2]: Leaving directory '/usr/src/s3fs-fuse/src'
make[1]: Leaving directory '/usr/src/s3fs-fuse/src'
Making install in test
make[1]: Entering directory '/usr/src/s3fs-fuse/test'
make[2]: Entering directory '/usr/src/s3fs-fuse/test'
make[2]: Nothing to be done for 'install-exec-am'.
make[2]: Nothing to be done for 'install-data-am'.
make[2]: Leaving directory '/usr/src/s3fs-fuse/test'
make[1]: Leaving directory '/usr/src/s3fs-fuse/test'
Making install in doc
make[1]: Entering directory '/usr/src/s3fs-fuse/doc'
make[2]: Entering directory '/usr/src/s3fs-fuse/doc'
make[2]: Nothing to be done for 'install-exec-am'.
/bin/mkdir -p '/usr/local/share/man/man1'
/usr/bin/install -c -m 644 man/s3fs.1 '/usr/local/share/man/man1'
make[2]: Leaving directory '/usr/src/s3fs-fuse/doc'
make[1]: Leaving directory '/usr/src/s3fs-fuse/doc'
make[1]: Entering directory '/usr/src/s3fs-fuse'
make[2]: Entering directory '/usr/src/s3fs-fuse'
make[2]: Nothing to be done for 'install-exec-am'.
make[2]: Nothing to be done for 'install-data-am'.
make[2]: Leaving directory '/usr/src/s3fs-fuse'
make[1]: Leaving directory '/usr/src/s3fs-fuse'
Configure access keys of your AWS account
Now you need to configure your AWS account security keys in s3fs utility. For that you need to visit your AWS account’s IAM (Identity and Access Management) page and get those keys under ‘Access Keys (Access Key ID and Secret Access Key)‘. If you haven’t created any till the time, then you can create a new key pair and use it.
There are two keys: Access Key ID and Secret Access Key. Add those keys in file/etc/s3fs-keysseparated by a colon. You can keep them in any file name and path of your choice. I prefer to keep it in /etc where other OS imp files reside.
Remove other permission to read this key file. If you don’t set permission 0 to others then s3fs command utility will warn you about it like below. For extra security you can make this file hidden by adding . in the filename.
s3fs: credentials file /etc/s3fs-keys should not have others permissions.
Now you are ready to mount your bucket.
Mount S3 bucket
Now run s3fs utility with bucket name you want to mount followed by directory on which you want to mount it. -o switch to be used to specify a key file path. If you used another filename and path than /etc/s3fs-keys then use it accordingly. There are many other options that can be supplied with this command to control cache and permission on the Linux server (OS side) which I haven’t mentioned here.
You can perform all file and directory operations as you do on normal mount point. Observe size it showing – 256T! That’s huge, that’s S3 – almost unlimited storage!
You can add an entry in /etc/fstab to mount your bucket on boot too. Use below entry :
If your bucket name includes . then s3fs may fail to mount your bucket. Curl will exist the mount operation as SSL on Amazon won’t be matched as certificate wild card matching fails due to extra . in your bucket name. To understand, if I have bucket name kerneltalks.bucket then SSL wildcard mismatch will happen as indicated by below error –
SSL: certificate subject name (*.s3.amazonaws.com) does not match target host name ‘kerneltalks.bucket.s3.amazonaws.com’
To see errors, warning during mount operation you can run s3fs command with debugging on. Append below switches to the end of your s3fs mount command:
-d -d -f -o f2 -o curldbg
This will help you troubleshoot any issues you faced during the S3 bucket mount.
This is how we mount S3 bucket in Linux servers like Redhat, Ubuntu, Debian, etc. Let us know if you have any feedback/comments/suggestions in below comment box.
Learn how to create an S3 bucket in AWS step by step. Understand permissions and properties of the bucket which are to be set while creating.
S3 bucket creation in AWS
S3 which stands for Simple Storage Service is a storage web service provided by Amazon web service. S3 is the replacement of storage boxes in traditional data centers. Its highly scale-able, cheap, reliable alternative. In S3 data is stored in a bucket. The bucket is the root folder in S3. You can have more than one bucket in a single AWS account. Files stored in buckets are called objects. You can control access to data by defining permissions at the bucket level and object level.
In this article we will see how to create S3 bucket with screenshots.
Step 1 –
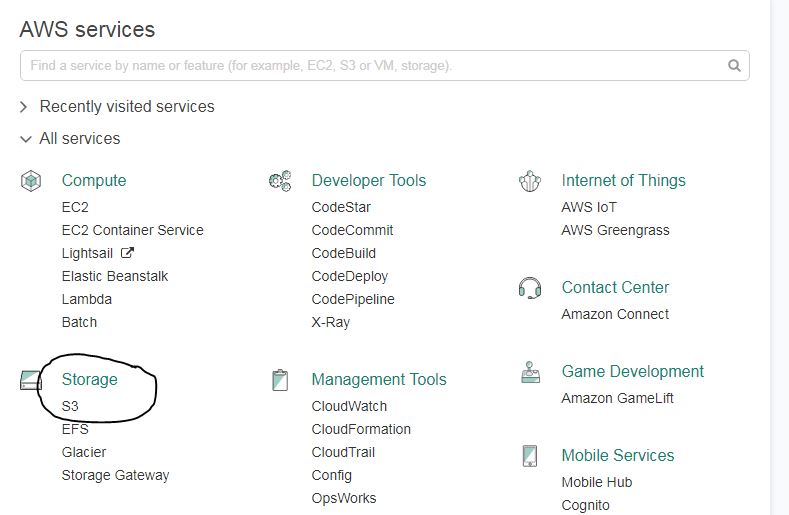
Login to AWS console and select S3 under Storage. You can even search it under the search bar of the console.
S3 in AWS console
It will take you to Amazon S3 console where you can see ‘create bucket‘ button along with Delete bucket and Empty bucket button in header.
S3 console
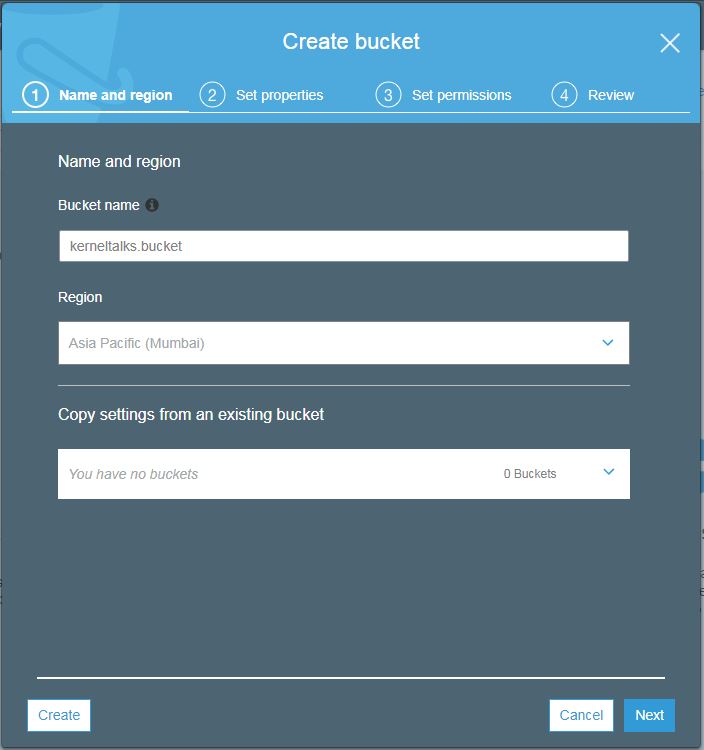
Step 2 –
Click create a bucket and you will be presented with bucket wizard. Enter the bucket name of your choice. Remember it should be unique across all AWS infrastructure. Select region (geographically nearest to source/destination from where read/write of data will happen to/from this bucket to avoid latency). If you want to create a new bucket with the setting of the existing bucket, you can specify the existing bucket name in the last option.
Create bucket wizard
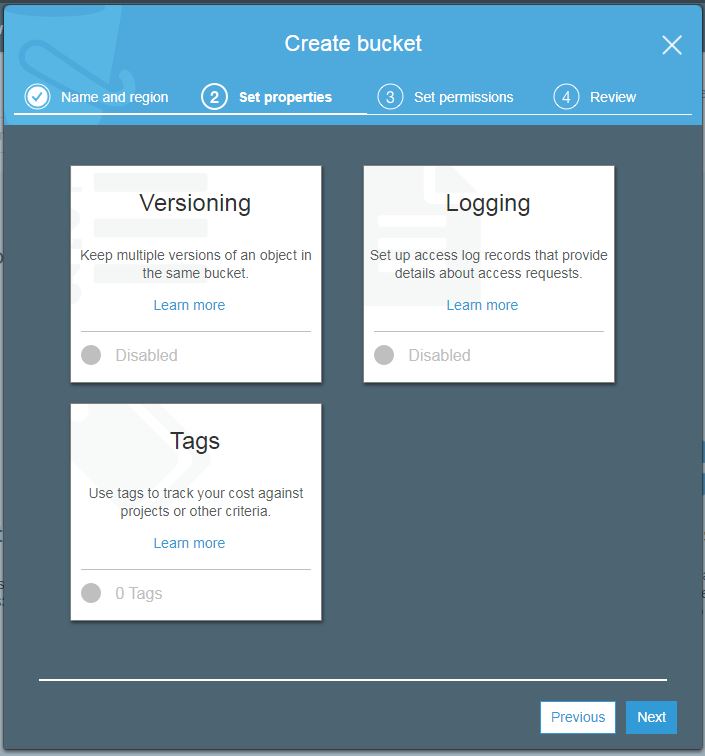
Hit next after filling the required details. You will enter the bucket properties screen as below.
S3 Bucket properties
Here you can set these properties to your bucket.
Versioning. Enable to keep all versions of objects when altered. Once enabled it can not be disabled. It can only be suspended then.
Logging. It will track all access requests made to this bucket.
Tags. Add tags of your choice to identify bucket easily in other AWS services and billing.
All are disabled by default. Once you enable features of your choice hit next. You will enter the permission settings screen.
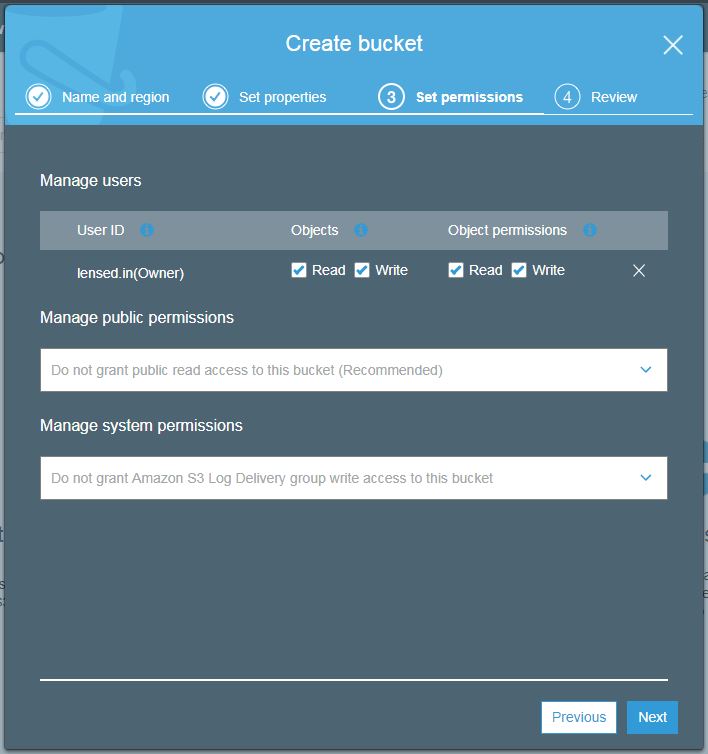
S3 bucket permissions
Here you can manage permissions at the user, public, and system level. Public and system permissions can be enabled or disabled. User-level permission can be set read, write and user id wise.
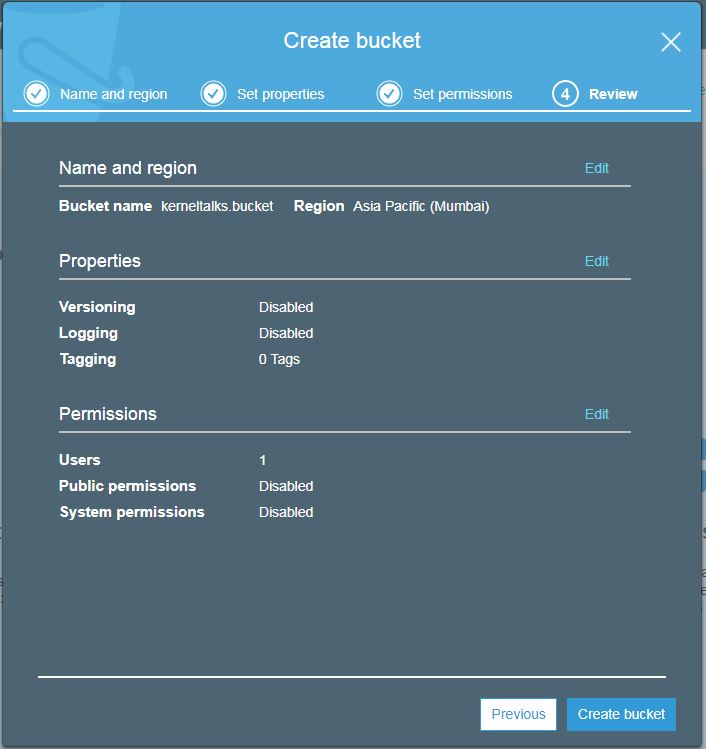
Once you are done, hit next and the review screen will show you all the options you have selected as a final confirmation before creating a bucket.
Bucket review screen before creation
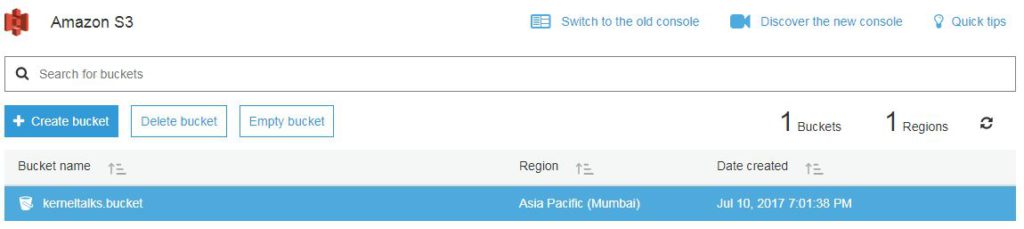
Hit create bucket now. Your bucket will be created and you will be redirected back to bucket list screen where you can see your newly created bucket!
Bucket list
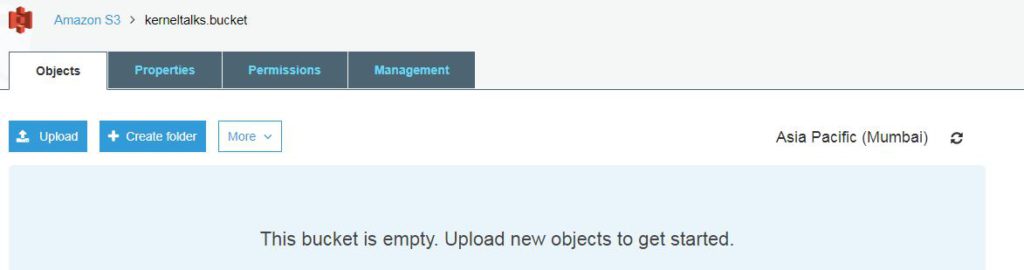
Step 3 –
If you click on bucket name you will be able to get into bucket itself where you can upload objects.
Inside S3 bucket
Even tabs like properties, permissions, management are visible in the menu bar which can be used to administer this bucket. We will see them in another post.
A how-to guide for Virtual Private Cloud in AWS. Learn what is vpc, how to create, configure, and delete VPC in AWS with screenshots.
How to guide : VPC in AWS
What is VPC?
VPC is a Virtual Private Cloud. It’s your own private cloud in the public cloud. You control every aspect of VPC and its communication with the outer world. It’s like having your own datacenter which is isolated from other datacenters. When you are using cloud services, you are working inside your VPC. Servers, storage, load balancer, databases everything you create, configure is executed under your VPC. VPC gives you great flexibility to control your data privacy and security even its on cloud.
How to create VPC in AWS?
We will walk through the process of creating VPC in AWS (Amazon Web Services) cloud. By default, one VPC is created for you when you create a new account with AWS. This VPC is marked as default VPC. Whenever you are using services within AWS, this VPC will be used by default if multiple VPC exists in your account.
Lets follow these series of screenshots to create VPC.
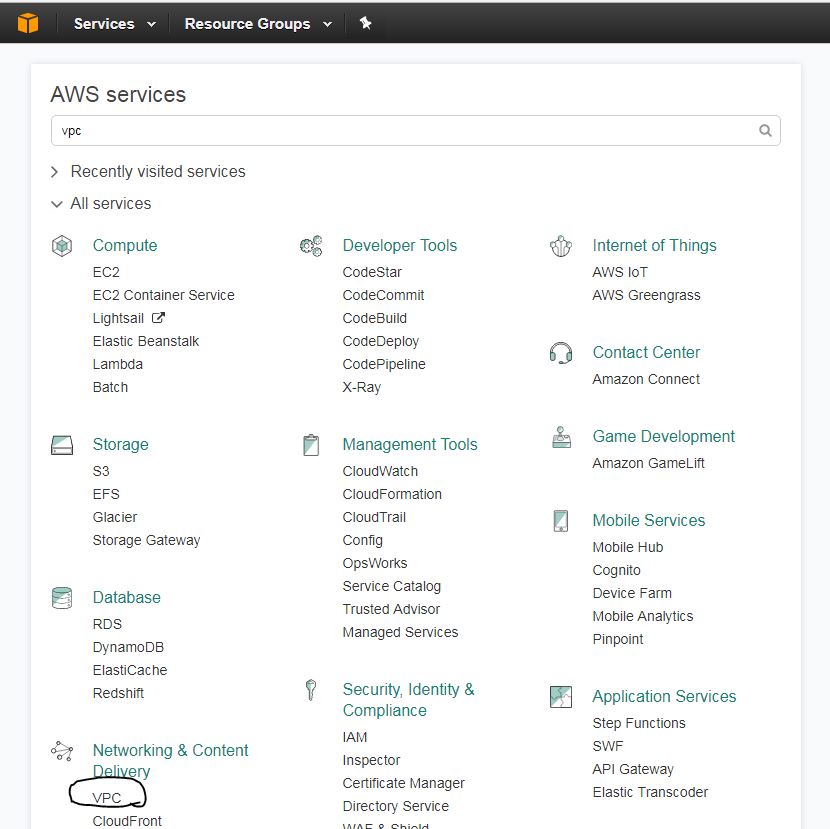
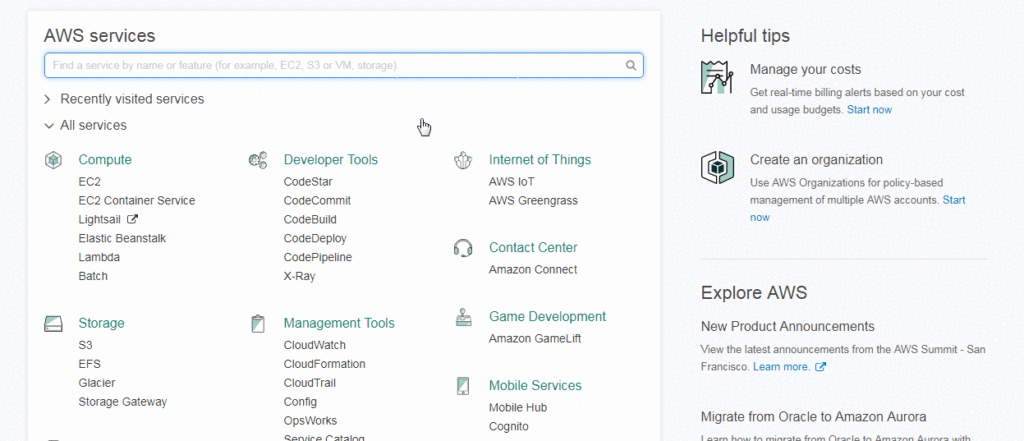
First login to your AWS management console and navigate to ‘VPC‘ under the category ‘Networking and Content delivery‘. See the below image. Or you can type VPC in the AWS services search bar you will be presented with VPC link.
VPC in AWS management console
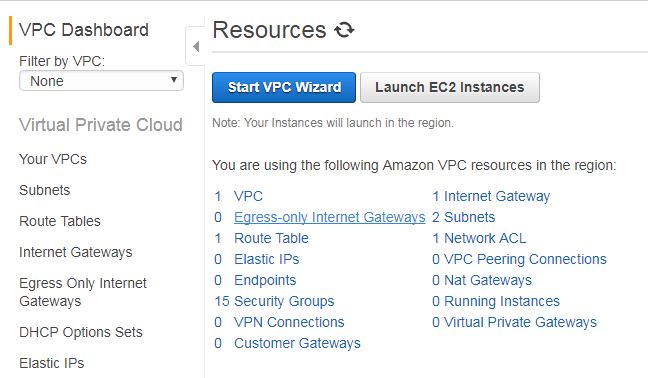
Now you will be presented with VPC dashboard which shows you a summary of your VPC resources like below :
VPC dashboard showing resources details
Here click on ‘Start VPC Wizard‘. This will kick off the VPC wizard to create your VPC step by step.
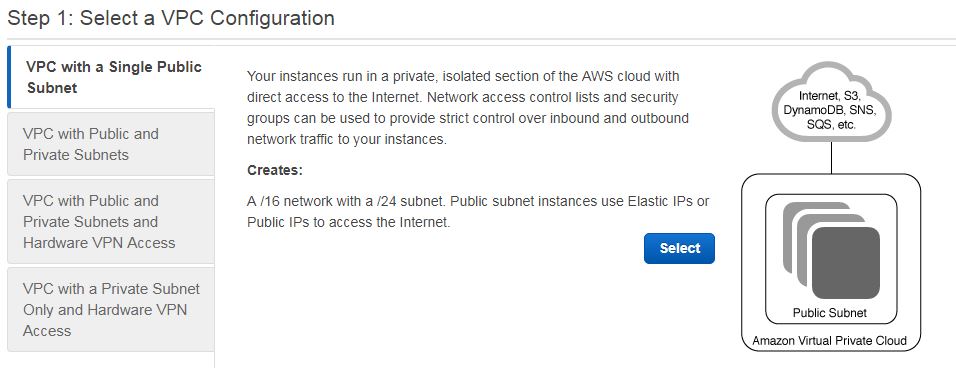
Step 1 :
Choose which kind of VPC you need. You have these choices –
VPC with a single public subnet
VPC with public and private subnets
VPC with public and private subnets with hardware VPN access
VPC with private subnet only with hardware VPN access
Each choice has its own features to offer. You can see what it offers by clicking on it. We will be creating the first type of VPC in this tutorial.
Select type of VPC
Select your type of VPC on the left column and then click on Select blue button on right.
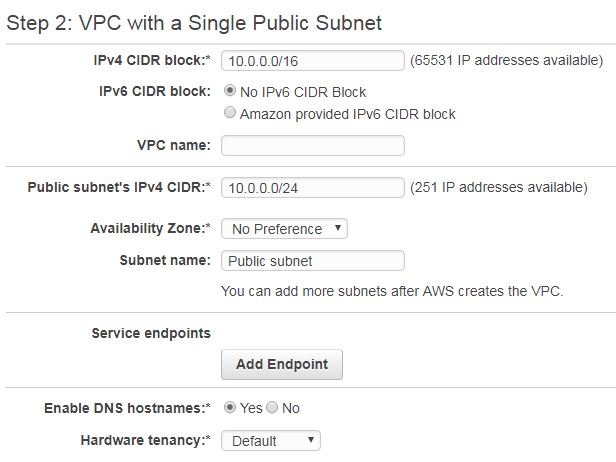
Step 2:
Here you need to configure your subnet IP ranges, hardware related stuff, etc. See below screenshot and we will understand each field one by one.
VPC configuration
IPv4 CIDR block: CIDR is Class-less Inter Domain Routing. It is your subnet range to be used by VPC. The IP addresses from this range will be assigned to components or services you will be using in this VPC. This is a mandatory field. You have to specify your range with subnet notation. Note that this range is configured and reachable only within your VPC.
IPv6 CIDR block: Optional field. You can have IPv6 support in your VPC with this. Here IP range will be automatically generated and assigned by Amazon. You do not have the privilege to choose your own.
VPC Name: Name of your choice. It helps you to identify this VPC in other parts of AWS within your account for configuration purposes. You can leave this blank since AWS identifies its every component by ARN (Amazon resource name). This ARN is an alphanumeric system-generated name that is not user friendly hence this field is optionally provided so that you can name your components with an easily recognizable name.
Public subnet’s IPv4 CIDR: This range is meant for outside world communication. Your resources will be assigned IP from this block when you want them to communicate outside VPC.
Availability zone: These zones are logical grouping of AWS hardware within one specified region (geographical grouping). At a one time you can select one region to work within and availability zones from that region will be listed here as a dropdown. If no zone selected, AWS will create VPC in any of the zones which has max free resources at that instant of time.
Subnet name: Again this one is to name your public subnet with an easily recognizable name.
Service endpoints: These are virtual devices in AWS. If you want any of them to add with this VPC then you can browse and select them here.
Enable DNS hostnames: It enables DNS names to be generated for components when they created in this VPC. These names are system generated.
Hardware Tenancy: Choose if you want your VPC components to be on single dedicated hardware (dedicated, physically as close as possible) or anywhere (physically may be near or long) within the zone you specified above. Dedicated tenancy assigns hardware which is the same rack or nearby racks so that you have very minimum network latency and highest performance.
Step 3 :
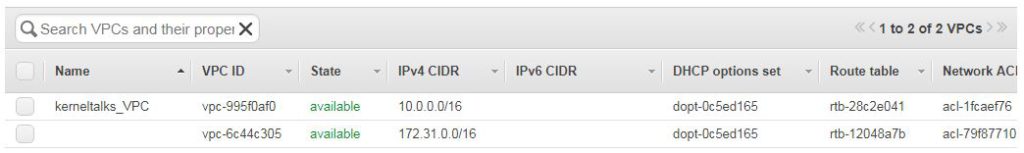
Click ‘Create VPC ‘ button. Your VPC will be created within seconds and you will be greeted with a screen saying “Your VPC has been successfully created. You can launch instances into the subnets of your VPC. For more information, see Launching an Instance into Your Subnet.” (link altered here with my blog post link). Click ok and you will be presented with VPC list screen as below :
VPC list
Here you can see out newly created VPC named kerneltalks_vpc! All details of this VPC can be seen here. You VPC is ready to
How to modify VPC in AWS?
After creation you can modify VPC parameters. From the VPC list shown above, select any VPC you want to edit and then click the Actions button in the header. Dropdown menu will appear to edit below parameters :
Delete VPC
Edit CIDRs
Edit DHCP options set
Edit DNS resolution
Edit DNS hostnames
Create flow log
Flow logs are created fro any resources in VPC to trace and see IP traffic flow information. The rest of the options are self-explanatory. Here you can modify VPc and delete VPC too.
Here is small GIF I created which shows all above process of creating VPC.
Beginners guide to learn shell scripting basics of If statement and for. while loops. The article includes small scripts of if, for and while loop.
Bash scripting : If, FOR & WHILE loop
This article can be referred to as a beginner’s guide to the introduction of shell scripting. We will be discussing various loops that are used in shell or bash scripting. In this chapter, we will discuss on if, for and while loop of scripting: if statement, for loop and while loop.
IF statement
If the loop is a conditional loop in scripting. It is used to check some conditions and perform actions based on the condition being true or false. If the loop structure is :
if [ condition ]
then
<execute this code>
else
<execute this code>
fi
If starts with condition check, if conditions match then it will execute the following code (after then). If the condition is false then it will execute code after else. If a statement can be used without else part too.
Example :
# cat if_statement.sh
#!/bin/bash
if [ $1 -lt 100 ]
then
echo "Your number is smaller than 100"
else
echo "Your number is greater than 100"
fi

# sh if_statement.sh 34
Your number is smaller than 100
If you execute this script, the loop will read the first argument as $1 and compare it with 100. Accordingly it will display output.
Bash FOR loop
Executing the same set of commands for the number of times loops are used in scripting. One of them is for loop. It takes input as a series of values and executes the following code repeatedly for each value. For loop structure is as below :
for i in <values>
do
<execute this code>
done
Here is reads values as a variable i and then $i can be used in the following code. Once all the values processed loops stops and script proceed to the next line of code.
Example :
# cat for_loop.sh
#!/bin/bash
for i in 1 2 3 4 5
do
echo First value in the series is $i
done

# sh for_loop.sh
First value in the series is 1
First value in the series is 2
First value in the series is 3
First value in the series is 4
First value in the series is 5
You can see variable $i is being fed with different values for each run of the loop. Once all values in range processed, the loop exits.
Bash WHILE loop
While is another loop used in programming which runs on condition. It keeps on running until the condition is met. Once the condition is un-matched, it exists. It’s a conditional loop! While loop structure is :
while [ condition ]
do
<execute this code>
done
While loop starts with the condition. If the condition is met it execute the following code and then again goes to verify condition. If the condition is still met then the next iteration of code execution happens. It continues to condition falses.
Example :
# cat while_loop.sh
#!/bin/bash
count=0
while [ $count -lt 3 ]
do
echo Count is $count
count=$(expr $count + 1)
done

# sh while_loop.sh
Count is 0
Count is 1
Count is 2
In the above example we have incremental counter code. We put up a condition for while loop is it can execute till counter less than 3. You can observe output the while loops exist when the counter hits 2.
These are three widely and commonly used for scripting! If you have any suggestions/feedback/corrections for this article please let us know in the comments below.
Learn to manage groups in Linux with these group management commands. The article includes how to create, modify, delete, and administer groups.
Group management in Linux
Groups on the Linux system are a bunch of users created for easy access/permission management. One user can be a member of one or many groups. Users will have only one primary and one/many secondary groups. In our other article we have seen user management commands in Linux/Unix. In this article we will discuss group management. There are mainly 4 commands used to manage user groups on Linux systems :
groupadd
groupmod
groupdel
gpasswd
Let’s check all these commands and fields they are responsible in /etc/group file.
groupadd command
As the name suggests, it is used to create new groups on the Linux system. groupadd command needs a group name as an argument.
This command creates a group named sysadmins. A newly created group can be verified in /etc/group file. Study fields in /etc/group file here.
Several common switches which works with groupadd are :
-g : Specify GID of your choice
-o : Create a group with non-unique GID
-r : Create a system group. (GID will be taken from system group GID range)
groupmod command
If you want to edit parameters like name, GID, uniqueness of group which already exist in the system then you can modify group using groupmod. Below the list of the switch with their desired values should feed to this command –
Observe above outputs where we changed the name, gid of the group and lastly we assigned the same GID 3 (non-unique) to our group which was already existing.
groupdel command
That’s the command where group ends their life! Yes, group deletion is performed using this command. This command is pretty simple. Just supply your group name and it will be deleted from the system.
# groupdel sysadmins
gpasswd command
This command is used to administer group. Administering groups includes :
Adding/removing users to/from group
Setting and removing group password
Making a user administrator/member of a group
Adding and removing user in the group is done with switch -a and -d followed by user name and lastly group name. Check below examples :
# gpasswd -a shri sysadmins
Adding user shri to group sysadmins

# cat /etc/group | grep sysadmin
sysadmins:x:3:shri

# gpasswd -d shri sysadmins
Removing user shri from group sysadmins

# cat /etc/group | grep sysadmin
sysadmins:x:3:
Password set is done without any switch while password removal is with -r switch as below :
# gpasswd sysadmins
Changing the password for group sysadmins
New Password:
Re-enter new password:
What is the use of group password in Linux?
This question comes to many of us. Hardly rather no one uses this feature at all. The idea must be to secure a group from non-member users. But since a group password should be known to all group members, it actually doesn’t make any sense to use it. Then you might ask then why group passwords exist in the first place? It may be just following the user (password security) model to groups as well to maintain symmetry in design. I mean it’s just my thought. Let me know if you have any other reason which suits group password existence!
Making any user administrator of the group grants him the privilege to administer the group. Member, the user is just a member of the group and can not administer it. You can make user administrator of the group with -A switch and member with -M. By default, the user is added to the group as a member
# gpasswd -A shri sysadmins
# gpasswd -M shri sysadmins
Those are all group management commands in Linux with their most used switches. Let us know any addition/correction/feedback in the comments!
Learn how to get user details by using finger command in Linux. List of switches for finger command and list of parameter information in this article.
Finger command howto!
The finger is a user information lookup program in Linux. It is used to get system user details like the user, home directory, last login, user shell, etc. This command is useful to see these parameters which otherwise you have to look under /etc/passwd and last login records.
Sometimes you will not find finger command in your out of box distribution. You can install a finger package and proceed to use this command. Sample output of installation on Redhat for your reference.
# yum install finger
Loaded plugins: amazon-id, rhui-lb, search-disabled-repos, security
Setting up Install Process
epel/metalink                                                                                                                         |  15 kB     00:00
epel                                                                                                                                  | 4.3 kB     00:00
epel/primary_db                                                                                                                       | 5.9 MB     00:04
rhui-REGION-client-config-server-6                                                                                                    | 2.9 kB     00:00
rhui-REGION-rhel-server-releases                                                                                                      | 3.5 kB     00:00
rhui-REGION-rhel-server-releases/primary_db                                                                                           |  56 MB     00:00
rhui-REGION-rhel-server-releases-optional                                                                                             | 3.5 kB     00:00
rhui-REGION-rhel-server-releases-optional/primary_db                                                                                  | 5.4 MB     00:00
rhui-REGION-rhel-server-rh-common                                                                                                     | 3.8 kB     00:00
Resolving Dependencies
--> Running transaction check
---> Package finger.x86_64 0:0.17-40.el6 will be installed
--> Finished Dependency Resolution

Dependencies Resolved

=============================================================================================================================================================
 Package                      Arch                         Version                              Repository                                              Size
=============================================================================================================================================================
Installing:
 finger                       x86_64                       0.17-40.el6                          rhui-REGION-rhel-server-releases                        22 k

Transaction Summary
=============================================================================================================================================================
Install       1 Package(s)

Total download size: 22 k
Installed size: 27 k
Is this ok [y/N]: y
Downloading Packages:
finger-0.17-40.el6.x86_64.rpm                                                                                                         |  22 kB     00:00
Running rpm_check_debug
Running Transaction Test
Transaction Test Succeeded
Running Transaction
  Installing : finger-0.17-40.el6.x86_64                                                                                                                 1/1
  Verifying  : finger-0.17-40.el6.x86_64                                                                                                                 1/1

Installed:
  finger.x86_64 0:0.17-40.el6

Complete!
Finger command requires the username as an argument. Without any switch finger shows below details.
# finger shrikant
Login: shrikant                         Name: Shrikant Lavhate
Directory: /home/ec2-user               Shell: /bin/bash
On since Wed Jul  5 00:31 (EDT) on pts/0 from 59.184.183.234
No mail.
No Plan.
It displays –
Login: Login id
Name: Comment in /etc/passwd against that user
Directory: Home directory of the user
Shell: The user login shell
Last login time and IP from where he/she was logged in
Email status
Plan : (the content of .plan file in user’s home directory)
Email status can be one of the below –
No Mail. : if there is no mail at all
Mail last read DDD MMM ## HH:MM YYYY (TZ): if the person has looked at their mailbox since new mail arriving
New mail received … : Same as above
Unread since … : if the user has new mail
Finger command switches
Finger command supports a few switches. The above output without any switch is the same output for the switch -l (multi-line listing). It also displays the content of the files .plan, .project, .pgpkey, and .forward from the user’s a home directory if they exist.
Another switch is -s which can be used for more information like terminal name, write status, idle time, login time and contact details, etc.
# finger -s  shri
Login     Name              Tty        Idle  Login Time   Office     Office Phone
shri      Shrikant Lavhate   *     *    No     logins
In this output you can see * for :
terminal: When the unknown device
Write status: If write permission is denied
login and idle time: If nonexistent
The last switch is -m which prevents user matching. Finger command matches the supplied user name in userid and user comment details. To avoid matching it in comment details and only check-in user ids this switch can be used.
Finger can even be used to lookup remote user information by using user@host format.
The story behind popular Linux mascot penguin named TUX! Read who, when, and how it was discussed, designed, and released.
Linux mascot penguin : TUX
One of my blog readers sent me a Penguin picture (of TUX) on messenger and asked how it is related to Linux. So I decided to write this short post about Linux mascot.
Linux mascot penguin : TUX
This post describes who is a tux, How it was designed, and when it was released as Linux mascot.
Linux official mascot is Penguin named TUX! TUX is an abbreviation for Torvalds’s Unix or Tuxedo (Black dinner suit which you can think of whenever you see penguin). The concept came from obviously none other than Linux’s creator Linux Torvalds.
The mascot was first designed by Larry Ewing in 1996 along with Alan Cox. Further it was finalized by Linux Torvalds. The mascot was discussed and refined on the Linux kernel mailing list. The mascot was first publicly released on GIMP by Larry. It’s said that, it was inspired by one of the penguin images by Nick Park on the FTP site.
Another inspiration said to be disease Penguinitis which Torvalds claims in Linux kernel discussion groups after penguin nibbled his finger in one close encounter. Penguins make you stay awake later in the night thinking about penguins. Some people in the Linux community believe it’s just a story but hey it’s good to have it behind mascot!
There were few Linux logo competitions held too which had a good response. Few logos from these competitions can be viewed here.
There are emails exchanged for this mascot available online. One of Linus Torvalds reply has his idea about mascot penguin. In his own words :
So when you think “penguin”, you should be imagining a slightly overweight penguin (*), sitting down after having gorged itself, and having just burped. It’s sitting there with a beatific smile – the world is a good place to be when you have just eaten a few gallons of raw fish and you can feel another “burp” coming.
(*) Not FAT, but you should be able to see that it’s sitting down because it’s really too stuffed to stand up. Think “bean bag” here.
You can view this email here on the Linux Kernel Mailing List thread. Interesting? You can surf May 1996 and after archives to read interesting conversations emails about Linux mascot. LKML is still an active list and you can see recent mails about Linux kernel development on their website.
So now you know the story behind TUX (Linux logo/mascot)! Now on, you will never see this penguin the way you used to since you know it does have a story, discussions behind its existence!
Understand what is LVM snapshot and why to use it. Learn how to create, mount, unmount, and delete the LVM snapshot.
LVM snapshot How to and when to!
LVM (Logical Volume Manager) is one of the widely used volume managers on Unix and Linux. There were series of LVM articles we published at kerneltalks in the past. You can refer them in below list :
In this article we will be discussing how to take snapshots of the logical volume. Since LVM is widely used, you must know how to take a backup of logical volume on the LVM level. Continue reading this article to know more about LVM snapshots.
What is LVM snapshot?
LVM snapshot is a frozen image of the logical volume. It is an exact copy of LVM volume which has all the data of volume at the time of its creation. LVM copies blocks or chinks from volume to volume so it’s comparatively fast than file-based backup. Backup volume is read-only in LVM and read-write in LVM2 by default.
Why to use LVM snapshot?
LVM snapshots are a quick and fast way to create a data copy. If your volume size is big and you can not tolerate performance issues while doing online data backup or downtime while doing offline data backup then LVM snapshot is the way to go. You can create snapshots and then use your system normally. While the system is serving production, you can take a backup of your backup volume at your leisure without hampering system operations.
Another benefit of using snapshot is your data remain un-changed while the backup is going on. If you take a backup of production/live volume then data on volume may change resulting inconsistency in the backup. But in case of snapshot since no app/user using it or writing data on it, taking backup from a snapshot is consistent and smooth.
How to take LVM snapshot?
LVM snapshots are easy to take. You need to use the same lvcreate command with -s switch (denotes snapshot) and supply the name of the volume to back up in the end. Important things here are to decide the size of the backup volume. If backup volume size is unable to hold data volume then your snapshot becomes unusable and it will be dropped. So make sure you have little extra space in backup volume than your original data volume (per man page 15-20% might be enough).
Lets create LVM snapshot.
# df -h /mydata
Filesystem              Size  Used Avail Use% Mounted on
/dev/mapper/vg01-lvol0   93M  1.6M   87M   2% /mydata

# lvcreate -L 150 -s -n backup /dev/vg01/lvol0
  Rounding up size to full physical extent 152.00 MiB
  Reducing COW size 152.00 MiB down to maximum usable size 104.00 MiB.
  Logical volume "backup" created.
In the above example, we created a snapshot of 100MB logical volume. For snapshot we defined 150MB space to be on the safer side. But command itself reduced it to 104MB optimum value to save on space. We also named this volume as a backup with -n switch.
Once the snapshot is created it can be mounted as any other logical volume. Once mounted it can be used as a normal mount point. Remember, LVM snapshots are read-only and LVM2 snapshots are read-write by default.
# mount /dev/vg01/backup /mybackup

# df -h
Filesystem              Size  Used Avail Use% Mounted on
/dev/mapper/vg01-lvol0  93M  1.6M   87M   2% /mydata
/dev/mapper/vg01-backup 93M  1.6M   87M   2% /mybackup
You can see after mounting backup volume its the exact same copy of the original volume. Original volume mounted on /mydata and backup volume mounted on /mybackup.
Now, you can take a backup of the mounted backup volume leaving original volume un-touched and without impacting its service to the environment.
How to delete LVM snapshot?
LVM snapshot deletion can be done as you delete the logical volume. After backup you may want to delete snapshot then you just need to unmount it and use lvremovecommand.
# umount /mybackup
# lvremove /dev/vg01/backup
Do you really want to remove active logical volume backup? [y/n]: y
  Logical volume "backup" successfully removed
Conclusion
LVM snapshots are special volumes that hold an exact copy of your data volume. It helps in reducing the overhead of read-write on data volume when taking backup. It also helps for consistent backup since no app/user altering data on snapshot volume.