AI Agents, Explained: A Guide for Beginners

If you’ve spent any time around technology in the last couple of years, you’ve heard the word “agent” thrown around a lot — usually with more excitement than precision. This post is an attempt to fix that. I’ll explain what an AI agent actually is, when you should (and shouldn’t) reach for one, how they work under the hood, the vocabulary you’ll keep bumping into, and the two things that decide whether an agent project succeeds in production: cost and safety.

AI agents!

I’ve written it to be readable if you’re brand new to AI, while still being concrete enough for an IT professional who has to make systems, design or architecture decisions.

First, what is an “agent”?

The idea is older than the current AI wave. In classic computer science, an intelligent agent is defined as “an entity that perceives its environment, takes actions autonomously to achieve goals, and may improve its performance through machine learning or by acquiring knowledge” (Wikipedia). That textbook framing — perceive, decide, act — still holds today.

The modern, cloud-vendor version says much the same thing in plainer words. AWS defines an AI agent as “a software program that can interact with its environment, collect data, and use that data to perform self-directed tasks that meet predetermined goals” (AWS). The key word is self-directed: you give it a goal, not a step-by-step script.

What’s new is the brain. In today’s agents, the control flow is “frequently driven by large language models” (Wikipedia). The LLM is what lets the agent understand a fuzzy instruction in plain English, decide what to do next, and adapt when things don’t go as planned.

The one distinction that clears up most confusion: workflows vs. agents

Here’s the single most useful mental model I’ve found, from Anthropic’s engineering team. They separate “agentic systems” into two categories:

  • Workflows are “systems where LLMs and tools are orchestrated through predefined code paths.”
  • Agents are “systems where LLMs dynamically direct their own processes and tool usage, maintaining control over how they accomplish tasks” (Anthropic).

In a workflow, you wrote the flowchart and the LLM fills in the boxes. In an agent, the model decides the flowchart at runtime. That difference drives everything else — predictability, cost, and risk all shift when you hand the steering wheel to the model.

How an agent actually works

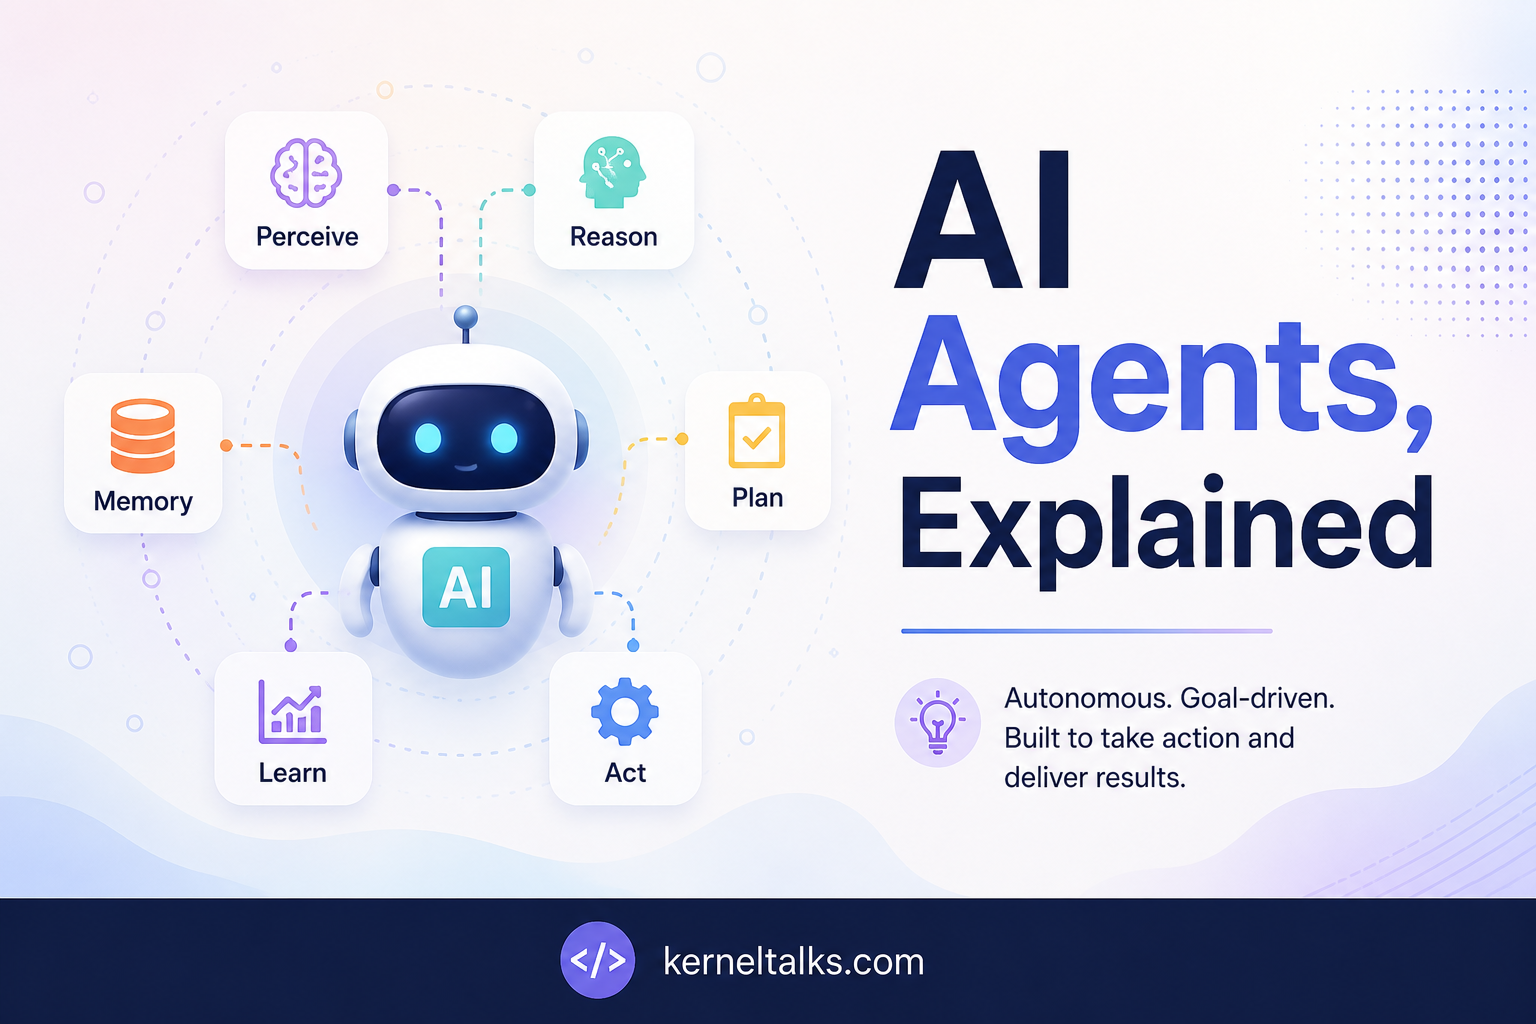
Strip away the hype and most LLM agents are, in Anthropic’s words, “just LLMs using tools based on environmental feedback in a loop” (Anthropic). That loop is the whole thing:

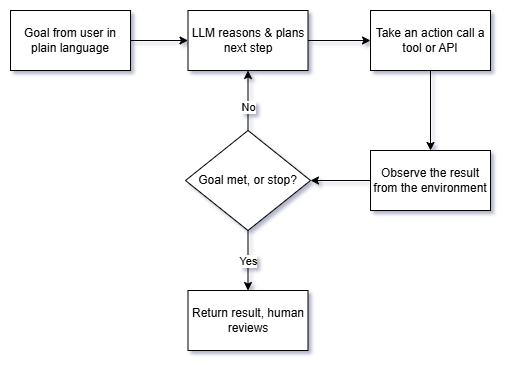
Walking through it the way AWS frames the process — determine the goal, acquire information, implement tasks, then evaluate outcomes and adjust (AWS):

  1. Goal in. A person gives the agent a task in natural language. A good agent will pause to clarify an ambiguous request before charging ahead.
  2. Reason and plan. The LLM decides what the next step should be.
  3. Act via a tool. The agent does something in the real world — queries a database, calls an API, runs code, sends an email.
  4. Observe. Critically, the agent must “gain ‘ground truth’ from the environment at each step (such as tool call results or code execution) to assess its progress” (Anthropic). This feedback is what separates an agent from a chatbot that just guesses.
  5. Loop or stop. It repeats until the goal is met or a stopping condition trips.

The building block: an “augmented LLM”

The atom of every agent is what Anthropic calls the augmented LLM — a language model enhanced with three capabilities: retrieval, tools, and memory (Anthropic). Modern models can actively generate their own search queries, pick the right tool, and decide what information is worth keeping. AWS describes a similar architecture: a foundation model, a planning module, a memory module, tool integration, and a learning/reflection mechanism (AWS).

The vocabulary you’ll keep hearing

Tools. A tool is anything the agent can call to affect or observe the world — a search API, a calculator, a code interpreter, a database query. The quality of your tool descriptions matters more than people expect. Anthropic recommends “poka-yoke” design (a manufacturing term for mistake-proofing) — writing tool parameters and descriptions so clearly, with examples and edge cases, that it’s hard for the model to misuse them (Anthropic).

Skills. A newer concept worth knowing: Skills are “folders that include instructions, scripts, and resources that Claude can load when needed” (Anthropic). They work through progressive disclosure — the agent scans available skills, and “when one matches, it loads only the minimal information and files needed,” which keeps it fast while still having specialized expertise on tap. Skills are composable (they stack), portable (“build once, use across Claude apps, Claude Code, and API”), and efficient because they only load what’s needed, when it’s needed (Anthropic). Think of a skill as a reusable competency you can hand to an agent, rather than cramming everything into one giant prompt.

MCP (Model Context Protocol). As soon as you want an agent to talk to real systems, you hit an integration problem: every tool has its own API. MCP is “an open-source standard for connecting AI applications to external systems.” The docs use a nice analogy — “think of MCP like a USB-C port for AI applications,” a standardized way to plug an agent into data sources, tools, and workflows (MCP). For IT teams, the appeal is “build once and integrate everywhere” instead of writing a bespoke connector per tool.

Memory. Agents distinguish between short-term memory (the current task’s context) and longer-term memory (things worth keeping across sessions). It’s one of the augmented-LLM enhancements above, and one of AWS’s core architecture components (AWS).

Multi-agent systems. Instead of one agent doing everything, you can have several specialized agents collaborate. Both the classical taxonomy and AWS list multi-agent systems as a category (Wikipedia; AWS). Anthropic’s orchestrator-workers pattern is a concrete version: a central LLM breaks a task into subtasks, delegates them, and synthesizes the results (Anthropic).

A quick note on “types of agents”

If you read the academic material, you’ll see five classical classes: simple reflex, model-based reflex, goal-based, utility-based, and learning agents (Wikipedia). AWS extends the list with hierarchical and multi-agent systems (AWS). You don’t need to memorize these, but they’re a useful reminder that “agent” is a spectrum of autonomy, not a single thing.

When to use an agent — and when not to

This is the section I wish more people read first. The honest guidance from Anthropic is to resist building an agent until you actually need one: “find the simplest solution possible, and only increasing complexity when needed.” Agentic systems “typically increase latency and costs while improving task performance,” so it’s a genuine trade-off, not a free upgrade. In fact, for many applications, “optimizing single LLM calls with retrieval and in-context examples is usually enough” (Anthropic).

A practical way to decide:

  • Use a workflow when the task is well-defined and you value predictability. If you can draw the flowchart yourself, hard-code it.
  • Use an agent when flexibility and model-driven decision-making are essential — the path can’t be known in advance, and the number of possible steps is large (Anthropic).

Common patterns that sit between a single prompt and a full agent are worth knowing, because they often solve the problem more cheaply: prompt chaining (sequential steps with checkpoints), routing (classify an input and send it to a specialist), parallelization (split work up, or run it several times and vote), orchestrator-workers, and evaluator-optimizer (one model generates, another critiques, in a loop) (Anthropic). My advice: try to solve your problem with one of these before you reach for full autonomy.

Keeping costs under control

Because agents run the LLM in a loop and call tools repeatedly, cost and latency are design concerns from day one, not afterthoughts. The trade-off is baked in — more autonomy means more model calls (Anthropic). Grounded in the sources above, here’s how to keep the bill sane:

  • Don’t build an agent you don’t need. The cheapest agent is the one you avoided by using a single well-designed LLM call, a retrieval step, or a fixed workflow instead (Anthropic).
  • Set stopping conditions. Anthropic explicitly recommends limits like a maximum number of iterations so an agent can’t loop forever and quietly run up cost (Anthropic). This is the single most important cost guardrail.
  • Load only what’s needed. This is exactly why progressive disclosure in Skills matters — it “only loads what’s needed, when it’s needed” instead of stuffing every instruction into context on every call (Anthropic). Less context per call means lower token cost.
  • Match the pattern to the task. A routing step that sends easy requests down a cheaper path, and only hard ones to the expensive full-agent path, can cut cost dramatically (Anthropic).

A caveat, so I don’t overstate things: specific pricing, token rates, and model-tier costs change constantly and depend on your provider. Check the current pricing page for whatever model you use — I’m deliberately not quoting numbers the sources didn’t give me.

Security, guardrails, and human oversight

Handing an autonomous system access to your tools and data is a real risk surface, and the sources are consistent about how to manage it: test in isolation, constrain what the agent can do, and keep a human in the loop.

  • Test in a sandbox. Anthropic calls “extensive testing in sandboxed environments” essential before you let an agent loose (Anthropic). Give it a safe playground before it touches production.
  • Design tools to prevent mistakes. The poka-yoke principle again — make dangerous or ambiguous tool use structurally hard, not just discouraged (Anthropic).
  • Use platform guardrails. Managed services provide built-in safety layers; AWS points to “Amazon Bedrock Guardrails” as an example of built-in security for agents (AWS).
  • Keep humans in the loop. Agents should be able to pause for human feedback “at checkpoints or when blocked” (Anthropic), and human review remains a core safeguard against biased or inaccurate output (AWS). For anything irreversible — sending money, deleting data, emailing customers — a human approval step is not optional.

If you take one security principle away: an agent should never have a capability you wouldn’t hand to a brand-new employee on their first day without supervision.

Bringing it together

Here’s the whole picture in one view:

  • An AI agent takes a goal in plain language and pursues it self-directedly.
  • Under the hood it’s an augmented LLM (model + tools + memory + retrieval) running a perceive → reason → act → observe loop.
  • Skills package reusable expertise; MCP standardizes how the agent connects to the outside world; multi-agent setups split work across specialists.
  • Reach for an agent only when a simpler workflow won’t do — autonomy costs latency and money.
  • Stopping conditions, sandboxing, and human oversight are what make the whole thing safe to run.

The technology is genuinely useful, but the teams who succeed with it are the ones who stay skeptical: they start simple, add autonomy only where it earns its keep, and never let an agent act unsupervised on anything that’s hard to undo.
Understanding the CLAUDE.md File: A Beginner’s Guide to Getting More Out of Claude

If you’ve started using Claude Code, you’ve probably hit the same small annoyance more than once: you explain your project, Claude helps, and then in the next session you’re explaining the very same things all over again. Which framework you use. Where the tests live. How you like your commits phrased. It’s like onboarding a new teammate every single morning.

Understanding claude.md

The CLAUDE.md file fixes exactly that. It’s one of the simplest features to set up and one of the highest-leverage, especially once you understand what it’s really doing behind the scenes. This guide walks a first-time user through what it is, how it works, and how to use it well.

What is a CLAUDE.md file?

A CLAUDE.md is a configuration file that gives Claude project-specific context. The key detail — and the reason it matters so much — is that Claude automatically incorporates it into every conversation. You don’t have to attach it, paste it, or remind Claude it exists.

Mechanically, the file becomes part of Claude’s system prompt. In plain terms: every conversation starts with that context already loaded. So instead of re-describing your project each time, you write it down once and Claude simply knows it going forward.

Think of it as a persistent briefing note for your project. Whatever you’d find yourself repeating to a new collaborator is a good candidate for the file.

Where the file lives

You can place a CLAUDE.md in a few different spots depending on how widely you want it to apply:

  • Your repository root — the most common choice. Put it here so it applies to the project and can be shared with your team.
  • A parent directory — useful for monorepo setups where you want shared context sitting above several projects.
  • Your home folder — this applies universally, across all your projects, for instructions you always want in play.

You’re not limited to one. A home-folder file for your personal preferences plus a repo-root file for the project is a natural combination.

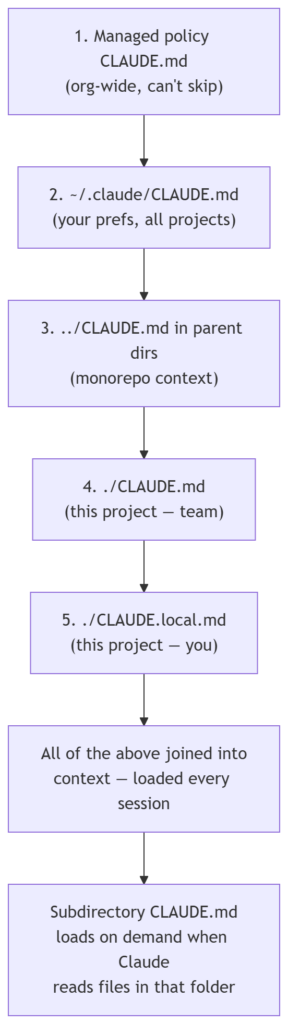
There isn’t just one CLAUDE.md — there’s a small hierarchy, each level with a different scope. Here they are, from broadest to most specific:

ScopeLocationWho it’s for
Managed policy (org-wide)macOS: /Library/Application Support/ClaudeCode/CLAUDE.md
Linux/WSL: /etc/claude-code/CLAUDE.md
Windows: C:\Program Files\ClaudeCode\CLAUDE.md
Everyone in your organization
User instructions~/.claude/CLAUDE.mdJust you, across all your projects
Project instructions./CLAUDE.md or ./.claude/CLAUDE.mdYour whole team (via source control)
Local instructions./CLAUDE.local.md (add to .gitignore)Just you, in this one project

As a beginner, you’ll care most about the project file (./CLAUDE.md at your repo root) and maybe your personal user file (~/.claude/CLAUDE.md). The managed-policy level is something an IT/DevOps team sets up centrally.

How the levels combine

Here’s the part that trips people up: these files don’t override each other — they’re all concatenated together into context. Claude also walks up the directory tree from wherever you launched it, picking up a CLAUDE.md in each parent folder along the way. Content is ordered from the filesystem root down to your working directory, so the instructions closest to where you’re working are read last.

One practical tip from the docs: to confirm which files actually loaded in a session, run /context and look under Memory files.

Getting started with /init

The easiest way to create your first one is to run the /init command inside Claude Code. It analyzes your codebase and generates a starter CLAUDE.md for you.

One honest caveat, straight from the source: /init “captures obvious patterns but may miss nuances specific to your workflow.” So treat what it produces as a first draft, not a finished document. Read it over, correct anything that’s off, and add the details it couldn’t have inferred. The generated file is a starting line, not a finish line.

How to structure your CLAUDE.md

You don’t need every section, but these are the kinds of things worth documenting:

  • A project summary and architecture overview — what the project is and how it’s put together.
  • Directory structure — the key folders and what lives where.
  • Coding standards and conventions — how you want code written.
  • Common commands, with examples — the build, run, and lint commands you use often.
  • Testing requirements and workflows — how tests are run and what’s expected.
  • Tool integration documentation — the tools your project relies on.
  • Development environment setup — what someone needs to get running.

The reference material includes a worked example built around a FastAPI project, showing the project structure, standards, and common commands all in one file, along with an example of a custom performance-optimization command. If you work in a different stack, the same shape applies — just fill it with your own project’s details.

Best practices worth adopting early

A few principles will keep your file useful rather than bloated:

  • Keep it concise and human-readable. This isn’t a formality. Because the file loads into context every single time, its length has a real cost. Conciseness is part of using Claude well, not just tidiness.
  • Start simple and expand based on friction. Don’t try to document everything up front. Add to the file when you notice yourself repeating an instruction or running into a recurring rough edge.
  • Split it up if it gets big. If the file grows unwieldy, one option is to break the information into separate markdown files and reference them from inside CLAUDE.md.
  • Document what your team actually does — the real workflows you follow, not the idealized version you wish you followed.
  • Never put secrets in it. Keep API keys, credentials, and database connection strings out. This matters especially because you’ll often commit the file to version control.

When should you add something to it?

The docs give a nice, concrete rule of thumb. Add to your CLAUDE.md when:

  • Claude makes the same mistake a second time.
  • A code review catches something Claude should have known about this codebase.
  • You type the same correction into chat that you typed last session.
  • A new teammate would need that same context to be productive.

Keep it to facts Claude should hold in every session: build commands, conventions, project layout, and “always do X” rules.

Two handy shortcuts: # and /clear

As you work, you can use the # key to quickly add an instruction you find yourself repeating. Over time, these additions accumulate into your CLAUDE.md — a low-effort way to grow the file organically instead of sitting down to write it all at once.

The /clear command is its companion. It resets the context window between distinct tasks while preserving your CLAUDE.md. So you can wipe the slate clean between unrelated jobs without losing the project context you’ve carefully set up.

Sharing with your team

Because a CLAUDE.md at the repo root travels with the project, you can commit it to version control so your team benefits from the same shared context. Everyone’s Claude starts from the same briefing. Just remember the earlier warning — since it’s now in your git history, keep sensitive information out of it.

There’s also room to grow beyond the file itself: you can create custom slash commands as markdown files in a .claude/commands/ directory, which is a natural next step once your CLAUDE.md is settled.

Start simple, expand deliberately

If you take one thing away, let it be this: begin small. Run /init, review what it produces, and let the file grow as your real workflow reveals what’s worth writing down. A short, accurate CLAUDE.md beats a sprawling one that nobody maintains — and it costs you less context on every conversation, too.
For a first-time Claude user, this single file is probably the fastest way to make Claude feel like it genuinely understands your project rather than projects in general. Set it up once, tend it occasionally, and you stop paying the “explain it all again” tax for good.
Self-Managed S3 Buckets for Lambda Code: You Finally Own the Artifact


Picture a platform team running a few hundred Lambda functions across a handful of accounts. Every function has several published versions kept around for safe rollbacks. One morning a deploy fails with a quota error, and the culprit isn’t the new function at all. It’s the 75 GB account-level limit on function and layer code storage, quietly filled up by copies of packages you thought lived in your own S3 bucket. If you’ve ever had to explain to a security reviewer why your deployment artifacts also sit in an internal bucket you can’t see, encrypt, or tag, this one is for you.

S3 buckets for Lambda code!

AWS has added a way to point Lambda at your own S3 bucket and have it read your code from there directly, with no hidden second copy.

What actually changed

There’s a new function configuration setting called S3ObjectStorageMode. It has two values.

  • The default is COPY, which behaves exactly like Lambda always has. If you don’t set the field at all, you get COPY, so nothing about your existing functions changes on its own.
  • The new value is REFERENCE. Set it when you create or update a function, and Lambda stops copying your .zip package into its internal storage. Instead it keeps a reference to your S3 object and reads the code from your bucket when it needs it. Your object becomes the one canonical artifact.

The feature works in all AWS standard regions where Lambda is available, and there’s no extra charge for it beyond the normal S3 storage and request costs you’d pay anyway.

How it works, old way and new

Under the old model (now COPY), the flow looks like this: you upload a .zip to your bucket, call CreateFunction or UpdateFunctionCode with the bucket name and object key, and Lambda pulls that artifact into a service-managed bucket. It builds the optimized, runnable version of your function from that internal copy. The catch is that this copy counts against your 75 GB account quota, and you have no say over how it’s stored.

With REFERENCE, that copy step disappears. Lambda records where your object lives and reads it directly. Two things fall out of that. First, your package no longer counts toward the 75 GB limit, because there’s no Lambda-side copy to count. Second, creating and updating functions gets faster, since Lambda skips the copy-into-internal-bucket step. AWS describes this as a faster time to first invoke for new functions and after updates.

Architecture

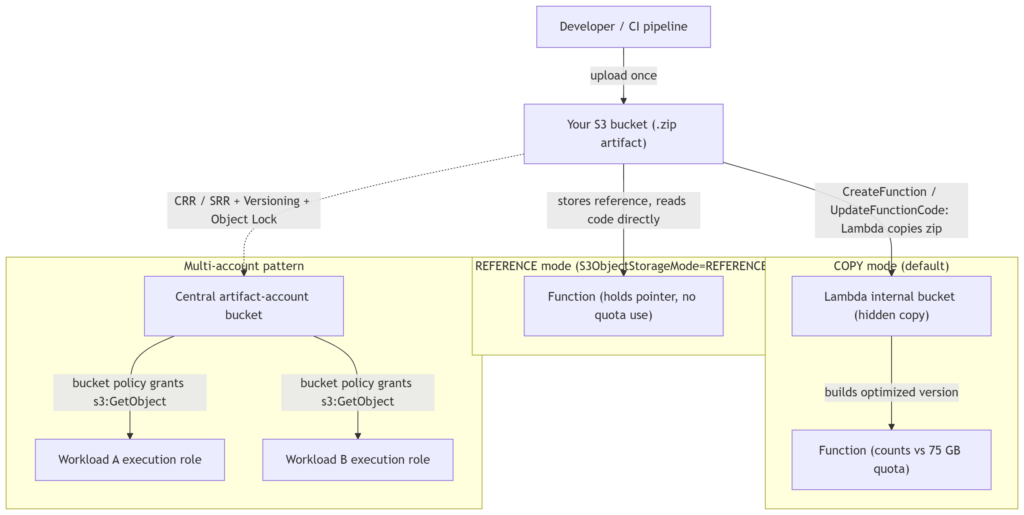
The diagram below contrasts the two modes and sketches the multi-account pattern that, in my experience, is the real reason to adopt this.

Two modes for S3 buckets of Lambda code.

In a COPY deployment, the artifact exists twice: once in your bucket, once inside Lambda. In REFERENCE mode there’s a single object, and your function holds a pointer to it. Extend that to an organization and the shape gets interesting: put every artifact in one bucket in a central “artifact” or shared-services account, then grant s3:GetObject to each workload account’s Lambda execution role through the bucket policy. Now one bucket is the source of truth for what’s deployed everywhere, with one place to enforce encryption, versioning, and retention.

When to reach for it

  • CI/CD and artifact management. Your pipeline uploads a package once, and the function references that same object. One set of lifecycle rules and access controls covers everything, and a rollback becomes “point the function at the previous S3 object version.”
  • Multi-account, multi-team setups. Centralize artifacts in one account, hand out cross-account s3:GetObject via bucket policies, and keep a single inventory of what code runs where.
  • Disaster recovery. Because you own the bucket, you can turn on Cross-Region Replication (CRR) or Same-Region Replication (SRR), and pair it with S3 Versioning and Object Lock to keep a tamper-resistant archive that survives an accidental delete or a corrupted deploy. See the S3 replication docs and S3 lifecycle examples.
  • Quota and compliance pressure. If you’re brushing up against 75 GB, or you need your own encryption, access logging, Object Lock, or compliance tags on the artifact, this gives you that control.

When to leave it alone

For plenty of workloads, COPY is fine and simpler. If you aren’t near the quota, don’t need custom encryption or tagging on the artifact, and have no DR requirement on your deployment packages, there’s little reason to change anything. The default exists for a reason.

Security notes

  • The trade in REFERENCE mode is control for responsibility. You now own the bucket’s posture: its encryption, access policies, lifecycle transitions, and audit trail are yours to configure and to get right.
  • For cross-account access, you grant s3:GetObject to the calling function’s execution role in the bucket policy.
  • Versioning plus Object Lock is the combination worth setting up early if you care about a durable, tamper-proof code archive.
  • The full IAM and bucket-policy details live in the Lambda developer guide.

Pricing

No additional charge for the feature. You pay the standard S3 storage and request costs for the object, which you were largely paying already if your artifacts lived in S3.

Limitations and open questions

It doesn’t state whether REFERENCE needs KMS decrypt permissions beyond s3:GetObject when you use customer-managed encryption (It should), exactly how a referenced object version is pinned for rollback, or what happens to a live function if the referenced object is later deleted or modified. Any latency effect from reading code directly at runtime isn’t discussed either. Confirm these against the Lambda console and the developer guide before you roll it out widely.

Bottom line

This is a small setting with an outsized effect for teams operating at scale. If the 75 GB quota or “we can’t audit that copy” has ever slowed you down, S3ObjectStorageMode: REFERENCE is worth a look. Start on a non-critical function, get your bucket policy and versioning right, and expand from there. Original announcement on the AWS Compute Blog.

Lambda MicroVMs: When Functions Aren’t Enough and EC2 Is Too Much

Picture this: you’re building a browser-based notebook where data analysts paste in Python, load a 3 GB dataframe, generate a few charts, then wander off to a meeting. Ninety minutes later they come back and expect their kernel, their variables, and their half-finished plot to still be sitting there.

AWS Lambda MicroVMs

Now try to build that on what AWS gave you before June 2026. Lambda? Fifteen-minute execution ceiling, no persistent process between invocations, no way to hold that dataframe in memory across the analyst’s coffee break. ECS or EC2? Sure, but now you’re running per-user containers or VMs, paying for idle capacity, and writing your own scheduler to reap dead sessions. Fargate gets you closer, but you still own the isolation story when the code being run was generated by an LLM you can’t fully trust.

This is the gap Lambda MicroVMs is aimed at.

What actually launched

AWS Lambda MicroVMs is a new compute primitive that exposes the Firecracker virtualization layer (the same one that has always run underneath Lambda) as something you can address directly. You get per-instance hardware isolation, snapshot-based startup, and — this is the part that matters — the ability to keep a single execution environment alive for an entire working session rather than a single request.

Alongside it, AWS shipped a companion resource called the Lambda Network Connector (LNC), which is how you attach a MicroVM to a private VPC when you need it to reach a database or an internal API.

How it actually works

Two resource types, and once you understand these the rest falls into place:

  • MicroVM image: a versioned artifact you build from a Dockerfile. When you create one, the service runs your Dockerfile, boots your application inside a MicroVM, and takes a Firecracker snapshot of the memory and disk state. Think of it as a “warm” image — dependencies already imported, JIT already warmed, whatever init your app does already done.
  • MicroVM: an instance launched from that image. Because it’s restored from a snapshot rather than cold-booted, it comes up close to instantly.

Each MicroVM gets its own HTTPS endpoint, and that endpoint speaks to individual ports on the guest — plain HTTPS, WebSockets, and gRPC all work, so you connect to it the same way you’d connect to any container you were running yourself.

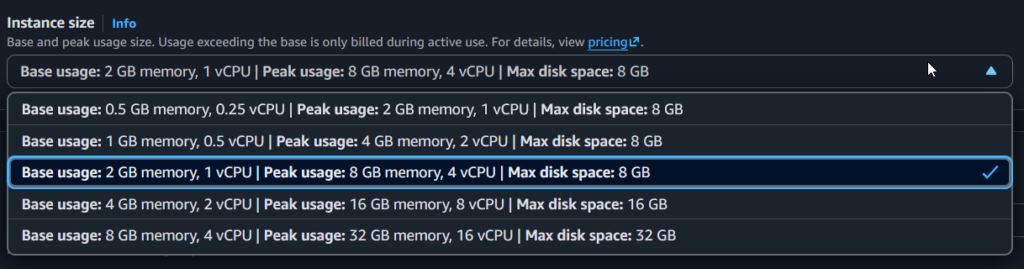
On sizing: the default baseline is 2 GB of memory and 1 vCPU. You can configure that up to 8 GB and 4 vCPUs at launch, with vCPU pinned to memory at a 2:1 ratio (memory in GB is double the vCPU count). From whatever baseline you pick, a MicroVM will auto-scale vertically up to 4x during peak demand. Horizontally, the service claims you can launch several hundred MicroVMs inside a minute.

Lambda MicroVMs Instance Sizes

Sessions can run from a few minutes up to eight hours. Egress to the public internet works out of the box; VPC access requires the LNC.

Architecture

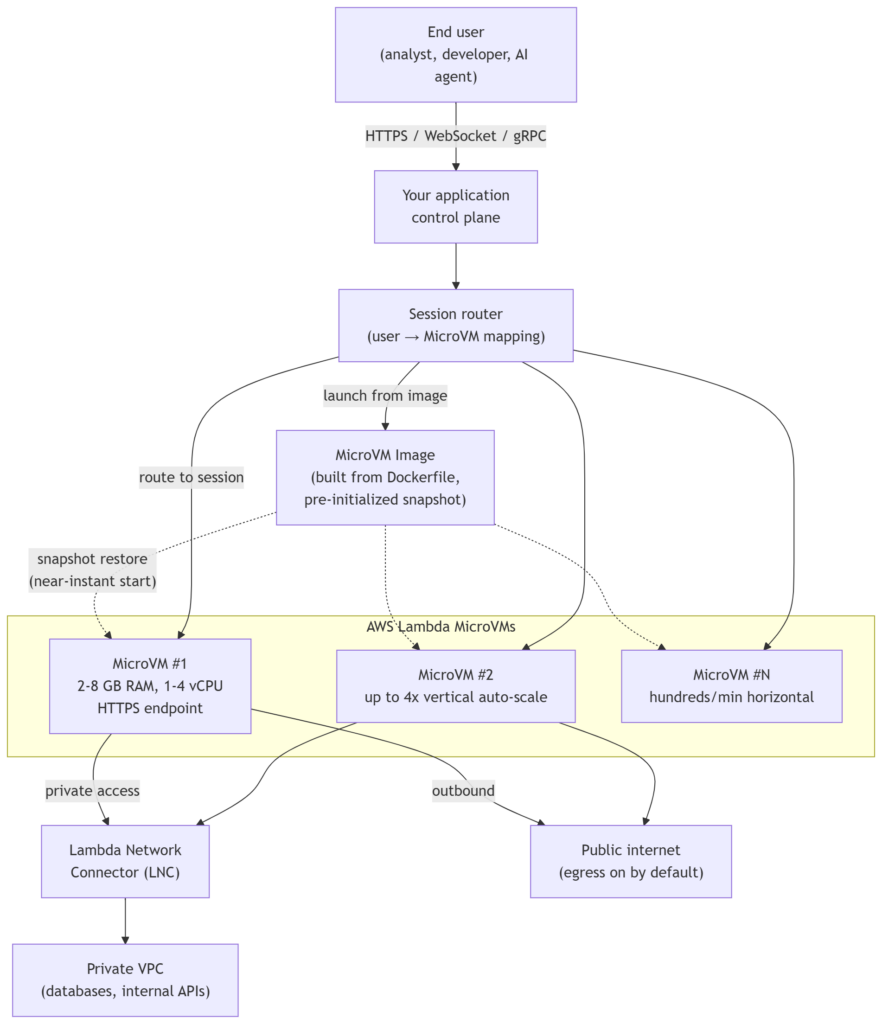
See the diagram below. The pattern is the per-session model: user requests come into your control plane, the control plane looks up whether that user already has a live MicroVM, and either routes traffic to the existing HTTPS endpoint or launches a new instance from a MicroVM image. When the user goes idle, you decide the lifecycle — keep it warm, snapshot it, or let it go.

AWS Lambda MicroVMs Flow

The interesting design question isn’t really “how do I launch a MicroVM” — it’s “who owns the session-to-endpoint mapping, and what’s my policy when the user disconnects?” You will end up building a small state machine. Plan for it.

When this is the right tool

  • Browser-based IDEs, notebooks, and the current wave of vibe-coding platforms — anywhere users bring their own code and expect their environment to feel persistent.
  • Analytics platforms running user- or LLM-generated queries where the working set is large and the session is long.
  • AI coding assistants that iterate on generated code and want to hold context between iterations, including RL-style loops that spin environments up and down to compare execution paths.
  • Security and vulnerability scanning where you need real isolation between scans and sometimes elevated OS privileges inside the guest.
  • CI/CD build and test runners where each job wants a clean, isolated box that starts fast.

When it probably isn’t

The launch material doesn’t call out anti-patterns directly, so treat this as my read rather than AWS’s guidance:

  • If your workload is stateless per-invocation and short, regular Lambda is still simpler and cheaper reasoning-wise.
  • If you need more than 8 GB of memory or 4 vCPUs per instance, you’re outside the MicroVM baseline envelope and you should look at Fargate or EC2.
  • If your sessions genuinely need to outlive eight hours without a snapshot/resume, this isn’t your primitive either.

Security notes worth reading twice

The isolation story is genuinely strong — hardware-level, one guest per user or job, which is the whole point of using Firecracker as a primitive rather than just a container runtime. That’s what makes it defensible as a sandbox for untrusted or model-generated code.

Two things to design around, though.

  1. First, outbound internet access is on by default. If you’re running untrusted code, you almost certainly want egress controls, and the launch material doesn’t spell out how granular those are — treat this as a question to answer before you go to production.
  2. Second, private VPC connectivity is not a checkbox; it requires configuring an LNC. Factor that into your networking design early, not late.

Pricing

Lambda MicroVMs are priced per instance-second. Check the Lambda pricing page (MicroVMs tab) before you commit to a design, especially for long-lived sessions — an eight-hour idle MicroVM has very different economics from a 200 ms function invocation.

Limitations to keep on the whiteboard

  • 2 GB / 1 vCPU baseline, 8 GB / 4 vCPU max, 2:1 memory-to-vCPU ratio.
  • Vertical auto-scale capped at 4x baseline.
  • Horizontal scale advertised as “several hundred per minute” during spikes — quantify this against your own burst profile before betting on it.
  • Sessions in the “few minutes to 8 hours” range; the exact hard upper bound isn’t explicitly stated.
  • VPC access is opt-in via LNC.

Wrapping up

The most useful way to think about Lambda MicroVMs is that AWS unbundled Firecracker from Lambda’s request/response model and let you address it directly, while keeping the parts of Lambda that were actually pleasant — no capacity planning, no patching, no scheduler to write. If you’ve been building per-user sandboxes on top of ECS or bare EC2 and feeling like you were re-implementing Firecracker badly, this is the primitive to evaluate.

Start with the product page and the developer guide, and if snapshot-based startup is new to you, the older SnapStart post is worth a read for the mental model. Networking details live in the LNC docs, and quotas are on the service limits page. And refer to this AWS Blog which walk you through AWS MicroVms.

Know about Amazon GuardDuty Investigation: AI-powered security analysis

Security teams routinely burn hours triaging a single GuardDuty finding. The workflow is familiar: pull the finding, pivot into CloudTrail, cross-reference VPC flow logs, chase the principal across accounts, map the behavior to a known technique, and finally decide whether the alert is a real incident or noise. Multiply that across an organization producing dozens or hundreds of findings a day, and investigation backlog becomes the bottleneck — not detection.

Amazon GuardDuty is now addressing that bottleneck directly. The GuardDuty investigation is available in public preview and performs on-demand, AI-powered investigations of GuardDuty findings, returning a structured assessment that a human analyst would otherwise assemble by hand.

What changed

The investigation agent adds a new capability to Amazon GuardDuty: rather than only surfacing findings, GuardDuty can now investigate them for you. Each investigation produces a structured output that includes a risk level, a confidence score, a natural-language summary, investigation details, MITRE ATT&CK technique mappings, resource mappings, and prioritized recommended actions — including specific AWS CLI commands the analyst can execute.

The agent is accessible through the AWS Management Console, the AWS CLI, AWS APIs, AWS SDKs, and the AWS MCP server — meaning it slots into both console-driven workflows and agentic security tooling built on top of the Agent Toolkit for AWS.

How it works

An investigation is initiated by an caller with appropriate permissions through the GuardDuty console, by calling the CreateInvestigation API, or via the AWS CLI. The target can be:

  • a specific GuardDuty finding
  • a member account
  • an entire AWS organization

CLI and API callers can supply a free-form natural-language trigger prompt of up to 2,048 characters to steer the investigation — for example, focusing the agent on a particular hypothesis or scope.

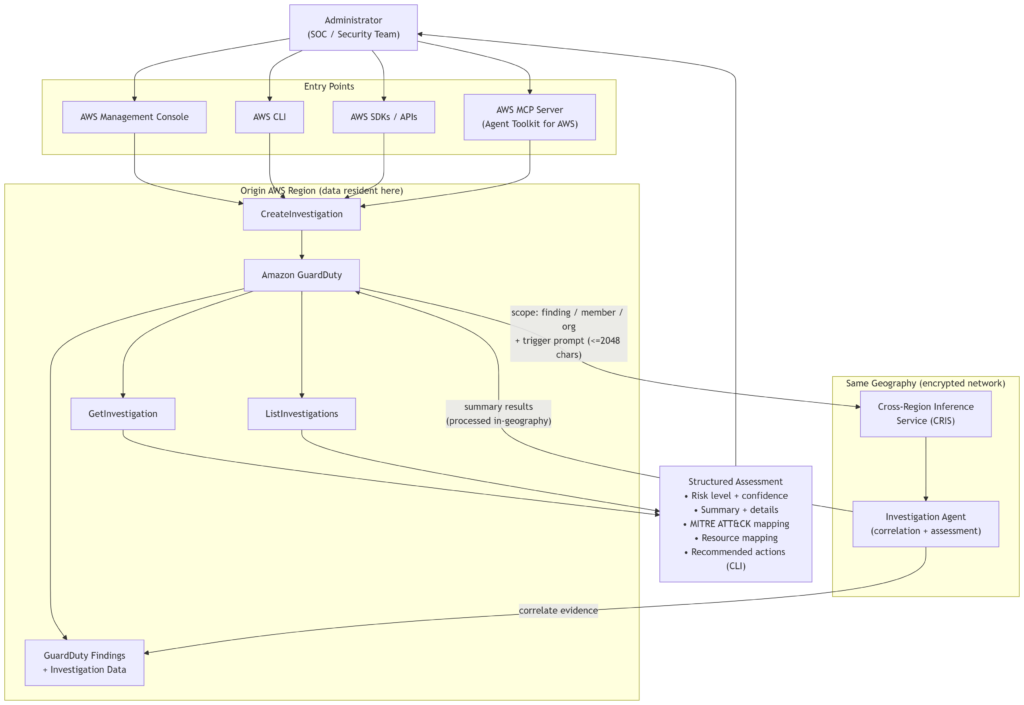
Under the hood, the agent correlates findings and evidence and returns a structured assessment. Results are retrieved with GetInvestigation, and prior investigations can be enumerated with ListInvestigations.

Processing uses cross-Region inference via the Cross-Region Inference Service (CRIS). Investigation data remains stored in the Region where the investigation was created, but inference and summary generation may occur in another Region within the same geography, transmitted over Amazon’s encrypted network.

Please go through this very detailed AWS blog that walks you through the whole investigation process – Amazon GuardDuty investigation agent: on-demand AI-powered threat assessment.

Architecture

The accompanying diagram shows the request flow: an administrator triggers an investigation from the console, CLI, SDK, API, or an MCP-connected agent; GuardDuty accepts the request in the origin Region; CRIS performs inference in-geography; and the structured assessment is returned to the caller while the underlying investigation data stays resident in the origin Region.

When to use it

The investigation agent fits naturally when you want to:

  • Triage a single GuardDuty finding without a manual pivot chase
  • Assess security posture across an entire AWS organization
  • Reduce manual correlation of evidence spread across CloudTrail, VPC flow logs, and other GuardDuty data sources
  • Wire GuardDuty investigations into AI-assisted security workflows through the AWS MCP server
  • Produce on-demand, structured threat assessments consumable by downstream automation

When not to use it

The agent is not the right tool if:

  • GuardDuty is not enabled in the account or organization
  • You are operating in a Region that does not support the preview
  • You need a member account to view another member’s or the administrator’s investigations, which is not permitted

Security considerations

Architecturally, three points matter for a review.

First, cross-Region inference. Investigation data is stored only in the origin Region, but processing and summary results may traverse another Region in the same geography. If your data-residency posture is scoped to a single Region rather than a geography, this is worth an explicit review before enabling the feature in regulated workloads. Please refer geography and their inference regions here.

Second, transport. Data moves across Amazon’s internal, encrypted network — but the residency point above still stands independently of encryption in transit.

Third, authorization. Investigations honor the existing GuardDuty authorization model. Callers can investigate only accounts they are already authorized to access. The three IAM actions to allow on principals that will drive investigations are:

  • guardduty:CreateInvestigation
  • guardduty:GetInvestigation
  • guardduty:ListInvestigations

Scope these on the administrator account role that runs the SOC’s investigation workflow, not broadly.

Pricing

In Preview mode, GuardDuty Investigations are made available at free of cost. Confirm current pricing in the GuardDuty product page before enabling at scale once its GA.

Limitations

  • The feature is in public preview.
  • GuardDuty must already be enabled, the account must be in a supported Region, and only administrator accounts can create investigations in admin as well as member accounts.
  • Member accounts cannot access investigations belonging to peer members or to the administrator.
  • Cross-Region inference behavior described above also applies.
  • During preview, 10 investigations/account/day with total limit of 100 investigations/account.Failed investigations do not count toward these quotas.
  • This feature is available only in the following 10 commercial AWS Regions: US East (N. Virginia), US East (Ohio), US West (Oregon), Canada (Central), Europe (Frankfurt), Europe (Ireland), Europe (London), Europe (Paris), Europe (Stockholm), and Asia Pacific (Tokyo).
  • The trigger prompt is capped at 2,048 characters when invoked through API/CLI.

Verify latest limitations against the GuardDuty investigation documentation before committing to a design.

Conclusion

The investigation agent shifts GuardDuty from a detection surface to a triage surface. For teams whose incident response cost is dominated by evidence correlation rather than detection, that is the interesting move. Preview status means the mechanics — Regions, quotas, latency, retention — need to be validated against your environment before it lands in a runbook, but the shape of the workflow is clear enough to start piloting against a defined scope, most sensibly a single administrator account or a bounded set of high-signal findings. Details and getting-started guidance are on the AWS Security Blog and in the GuardDuty documentation.

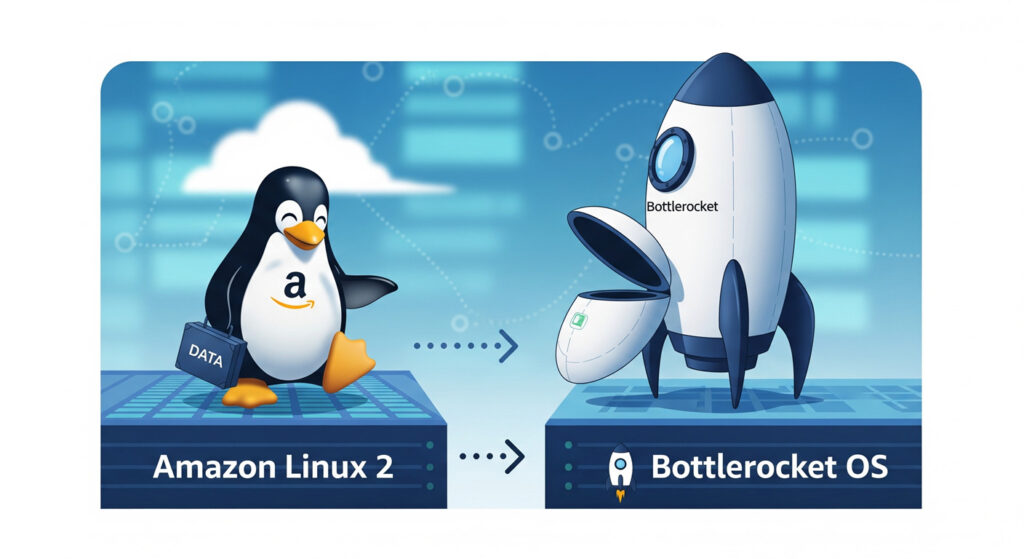
Migrating from Amazon Linux 2 to Bottlerocket AMI in EKS Nodes

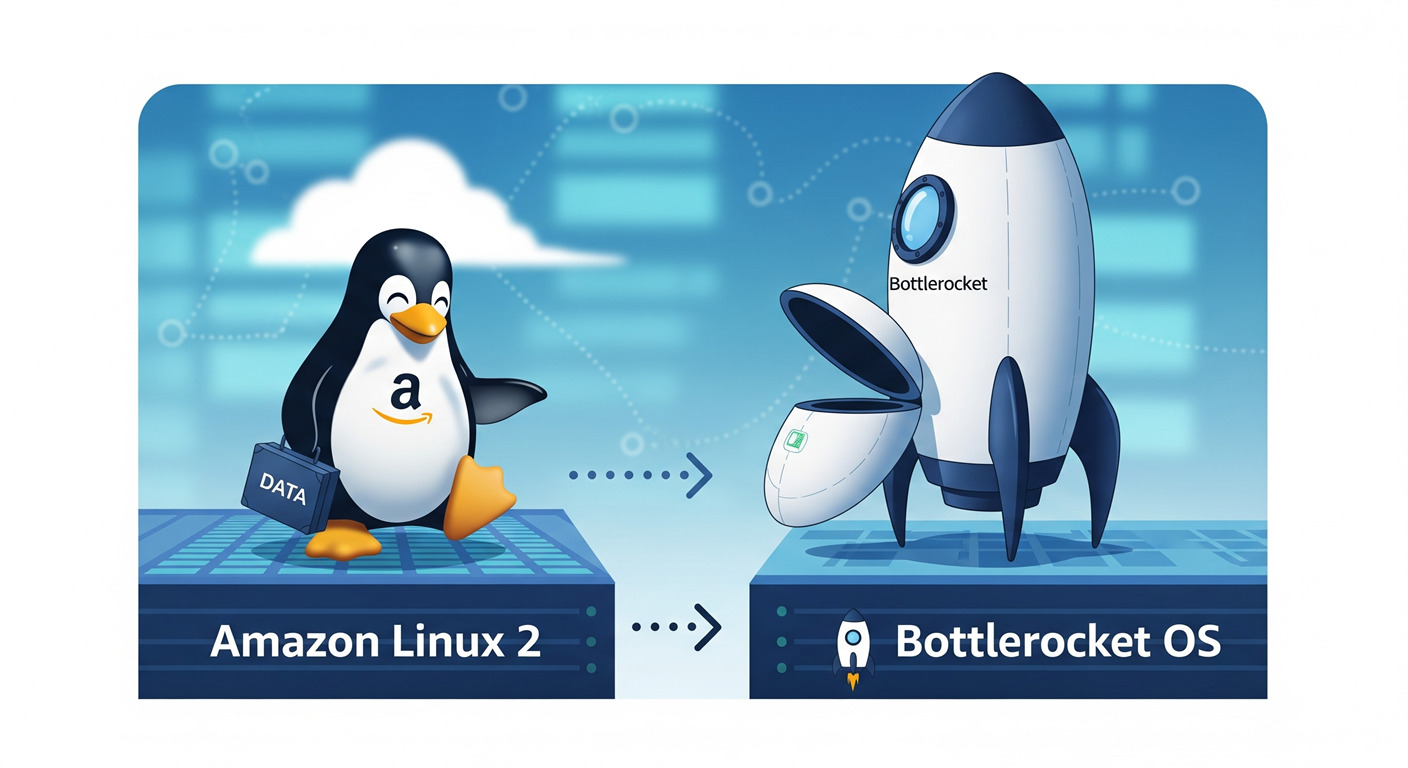
In this post, I share my journey transitioning from Amazon Linux 2 to Bottlerocket as the EKS node OS, aiming for enhanced security with a hardened OS image.

In my envionment, running Kubernetes workloads on Amazon EKS with Amazon Linux 2 (AL2) worker nodes is a tried-and-tested approach. It’s stable, compatible with most tooling, and offers the flexibility of a general-purpose Linux OS.

AL2 is a full Linux distribution meaning it ships with many binaries, libraries, and utilities that aren’t strictly needed for running containers. This fully blown OS increases the attack surface if not hardened properly. If an attacker compromises a node (through a container escape, misconfiguration, or another vector), these extra tools and privileges can be leveraged for deeper intrusion, persistence, and lateral movement.

Hence, it was a wise choice to explore Bottlerocket which is CIS hardened out of the box as a EKS node OS.

Bottlerocket: Minimal, Secure, Container-First OS

Bottlerocket is an open-source Linux-based OS purpose-built by AWS to run containers securely and with minimal overhead. It’s now officially published and supported for EKS and ECS, making it a good alternative to AL2 for containerization platforms. As Bottlerocket is CIS hardened out of the box, it saves so much of manual/automation work of hardening OS image.

Key Security Advantages of Bottlerocket over AL2

  1. Immutable Root File System
    • The root filesystem is read-only and protected with dm-verity (integrity verification).
  2. No Direct Package Installation
    • There’s no package managers (yum/apt).
    • All additional functionality runs in special-purpose containers (control or admin container), isolating changes from the host OS.
  3. No Default SSH Access
    • Bottlerocket blocks SSH by default.
    • Administrative access is through AWS Systems Manager (SSM) Session Manager, meaning you are covered with IAM and CloudTrail.
  4. Locked-Down System & Kernel
    • No direct systemd or kernel-level access from workloads.
    • The OS is configured and updated via a local API (protected by SELinux policies), avoiding risky manual edits.
  5. Atomic, Signed OS Updates with Rollback
    • Updates are applied as a full image to an inactive partition, verified with cryptographic signatures, and made active only after reboot.

Why BottleRocket could be a good choice?

Moving from AL2 to Bottlerocket removes unnecessary OS-level tools and privileges from your nodes, reducing the blast radius. Instead of manually hardening AL2 with CIS benchmarks, SELinux policies, and SSH lockdowns, Bottlerocket bakes these controls in by default.

This means:

  • Lower operational risk.
  • Less maintenance effort to stay compliant.
  • Better alignment with Kubernetes’ container-first security model.

Official Bottlerocket Documentation → https://bottlerocket.dev/en/os/1.42.x/

Our Migration Journey with Karpenter

In the earlier section, we discussed why we focused on Bottlerocket. Now, let’s talk about the how the actual activities we performed during our migration.

Our EKS cluster uses Karpenter for node provisioning instead of EKS-managed node groups. Hence this post focuses on Karpenter-specific configurations for using Bottlerocket AMIs.

Let’s get into the stepwise procedure –

1. Updating the EC2NodeClass Manifest

To provision Bottlerocket nodes with Karpenter, we updated our EC2NodeClass manifest as follows:

apiVersion: karpenter.k8s.aws/v1
kind: EC2NodeClass
metadata:
  name: bottlerocket-nodes
spec:
  amiFamily: Bottlerocket
  amiSelectorTerms:
    - alias: bottlerocket@v1.42.0
  blockDeviceMappings:
    - deviceName: /dev/xvda
      ebs:
        deleteOnTermination: true
        encrypted: true
        kmsKeyID: xxxxxxxx-xxxx-xxxx-xxxx-xxxxxxxx
        volumeSize: 10Gi
        volumeType: gp3
    - deviceName: /dev/xvdb
      ebs:
        deleteOnTermination: true
        encrypted: true
        kmsKeyID: xxxxxxxx-xxxx-xxxx-xxxx-xxxxxxxx
        volumeSize: 30Gi
        volumeType: gp3

Key Points

  • amiFamily must be set to Bottlerocket.
  • amiSelectorTerms.alias specifies the desired Bottlerocket version.
  • Avoid using bottlerocket@latest in production environments. As it points to an AWS-managed SSM parameter, if AWS updates the parameter value, Karpenter detect it as an AMI drift and recycle nodes (default check interval is 1 hour). It shuffles all the PODs in the cluster.

Pro tip: Instead of relying on @latest, you can implement your own AMI automation pipeline. Tag new AMIs with predefined keys (e.g., owner=myteam, version=1.42.0) and reference those tags in amiSelectorTerms.

2. Understanding Block Device Mappings

We explicitly defined two block devices for Bottlerocket nodes:

  • /dev/xvda — OS Volume
    • For Bottlerocket OS!
    • Contains active/passive partitions, bootloader, dm-verity metadata, and the Bottlerocket API datastore.
  • /dev/xvdb — Data Volume
    • Used for everything running on top of Bottlerocket i.e. container images, runtime storage, and Kubernetes persistent volumes.

If you don’t define /dev/xvdb in your manifest:

  • Karpenter defaults it to 20 GB of type GP2. I prefer gp3 for best price-performance ratio.
  • You may end up in insufficient disk space incidents.
  • /dev/xvda may end up larger than necessary, wasting EBS storage for the OS.

By making these changes, we were able to seamlessly migrate from AL2 to Bottlerocket in our Karpenter-managed EKS environment, gaining all the hardened security benefits without disrupting workloads.

3. User Data Script: Custom GuardDuty DNS Mapping on Bottlerocket

Background

In our setup, EKS cluster uses a self-hosted DNS instead of AWS’s default DNS. We’ve also enabled AWS GuardDuty threat detection for the cluster.

When GuardDuty protection is enabled, it creates a PrivateLink VPC endpoint whose DNS name is resolved inside the respective PODs. This PrivateLink is available in the subnets/AZs where it’s created (in our case: 3 subnets, AZs a, b, and c).

For GuardDuty’s DaemonSet to function correctly, all EKS nodes must be able to resolve its PrivateLink endpoint from within the same subnet they launched in.

How We Did It on AL2

On Amazon Linux 2, this was simple:

  • Add a shell script to EC2 user data.
  • Script fetchs the subnet-specific PrivateLink IP.
  • Appends the mapping to /etc/hosts.

The Bottlerocket Challenge

Bottlerocket can not execute raw shell scripts directly via EC2 user data.
Instead:

  • It uses TOML-formatted user data.
  • OS changes are made through the Bottlerocket API (apiclient).

Also, /etc/hosts exists on the read-only root filesystem, so direct edits are not possible.

Our Solution

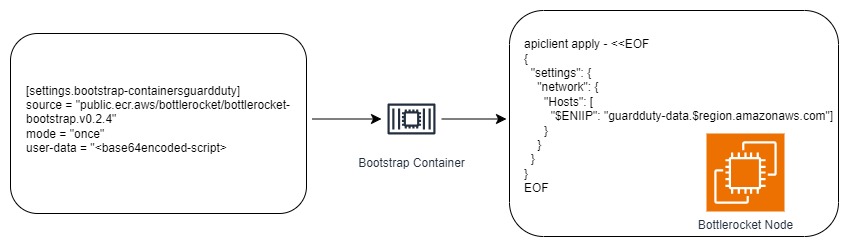
After researching the Bottlerocket design, we found three possible approaches:

  • Host containers (admin, control): Could run the script but admin requires enabling an SSH keypair, which we wanted to avoid.
  • Bootstrap containers: Run a container at instance boot before the kubelet starts.
  • apiclient API calls: The correct way to update /etc/hosts on Bottlerocket.

We opted to go ahead with bootstrap containers + apiclient.

Final User Data Configuration

Here’s the relevant part of our EC2NodeClass manifest for Karpenter:

apiVersion: karpenter.k8s.aws/v1
kind: EC2NodeClass
metadata:
  name: bottlerocket-guardduty
spec:
  amiFamily: Bottlerocket
  amiSelectorTerms:
    - alias: bottlerocket@v1.42.0
  blockDeviceMappings:
    ...
  userData: |
    [settings.bootstrap-containers]
    [settings.bootstrap-containers.guardduty]
    source = "public.ecr.aws/bottlerocket/bottlerocket-bootstrap:v0.2.4"
    mode = "once"
    user-data = "xxxvYmlxxxxxxxxxxxxxxxxxxxxxxxyBXT1JMXX=="

Note: The base64-encoded string shown in the bootstrap-container user-data is only a placeholder. Below are the detailed steps to generate the actual base64-encoded string for your script.

Implementation Steps

a) Create the shell script (myscript.sh)
This script uses apiclient to inject the GuardDuty PrivateLink mapping into /etc/hosts via the Bottlerocket API.

#!/bin/bash
set -euo pipefail

echo "[BOOTSTRAP] Starting GuardDuty host entry setup..."

# Get IMDSv2 token
TOKEN=$(curl -sX PUT "http://169.254.169.254/latest/api/token" \
  -H "X-aws-ec2-metadata-token-ttl-seconds: 60")

# Get metadata
MAC1=$(curl -s -H "X-aws-ec2-metadata-token: $TOKEN" \
  http://169.254.169.254/latest/meta-data/network/interfaces/macs/ | head -1 | tr -d '/')

VPCID=$(curl -s -H "X-aws-ec2-metadata-token: $TOKEN" \
  http://169.254.169.254/latest/meta-data/network/interfaces/macs/$MAC1/vpc-id)

AZ=$(curl -s -H "X-aws-ec2-metadata-token: $TOKEN" \
  http://169.254.169.254/latest/dynamic/<AWS-ACCOUNT-ALIAS>/document | jq -r .availabilityZone)

REGION=$(curl -s -H "X-aws-ec2-metadata-token: $TOKEN" \
  http://169.254.169.254/latest/dynamic/<AWS-ACCOUNT-ALIAS>/document | jq -r .region)

# Get GuardDuty ENI IP
ENIIP=$(aws ec2 describe-network-interfaces \
  --filters Name=vpc-id,Values=$VPCID \
            Name=availability-zone,Values=$AZ \
            Name=group-name,Values="GuardDutyManagedSecurityGroup-vpc-*" \
  --query 'NetworkInterfaces[0].PrivateIpAddress' \
  --region "$REGION" --output text)

if [[ -z "$ENIIP" || "$ENIIP" == "None" ]]; then
    echo "[BOOTSTRAP] No GuardDuty ENI IP found"
    exit 0
fi

cat > hosts.json <<EOF
{
  "settings": {
    "network": {
      "hosts": [
        ["$ENIIP", ["guardduty-data.$REGION.amazonaws.com"]]
      ]
    }
  }
}
EOF

apiclient apply < hosts.json

b) Encode the script in Base64
Bootstrap container user data must be Base64-encoded for TOML.

base64 -w 0 myscript.sh

c) Embed the Base64 string in user data
Paste the encoded string into:

[settings.bootstrap-containers.guardduty]
user-data = "&lt;base64-encoded-script>"

d) Validate execution
You can verify your bootstrap container ran successfully using:

aws ec2 instance --> Actions --> Monitor and Troubleshoot --> Get system log

Key Takeaways:

  • Use the network.hosts API setting for modifying contents of /etc/hosts
  • Bootstrap containers are the best way to run initialization scripts at boot.
  • Avoid enabling the admin host container with SSH just for automation, it defeats the purpose of Bottlerocket’s out of the box hardening.

Final Thoughts

In this blog, we’ve shared the insights and hands-on learnings we’ve gathered while working with Bottlerocket. Since there’s limited practical guidance available online, we thought to share our experience. In a summary: migrating from Amazon Linux 2 to Bottlerocket for EKS node hardening not only strengthens security but also changes how we interact with the underlying OS. While certain tasks like running userdata scripts require a different approach, Bottlerocket’s design ensures a minimal attack surface, immutable infrastructure, and tighter control over system access. With the right methods, such as leveraging bootstrap containers and the Bottlerocket API, you can still meet your operational requirements without compromising on security.

KubeCon + CloudNativeCon India 2025: My experience

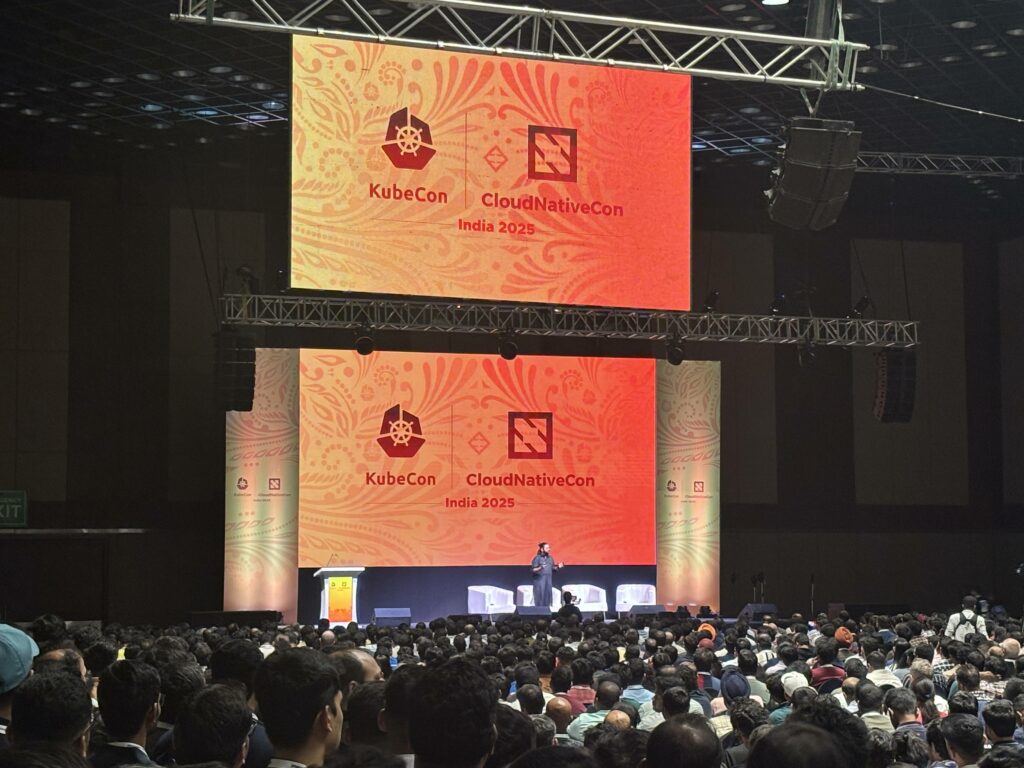
From scaling Kubernetes, observability, powering huge AI projects to real stories from PepsiCo, Flipkart, and Intuit, KubeCon + CloudNativeCon India 2025 in Hyderabad was a deep dive into where cloud-native ecosystem is headed. Here’s my personal experience about the event.

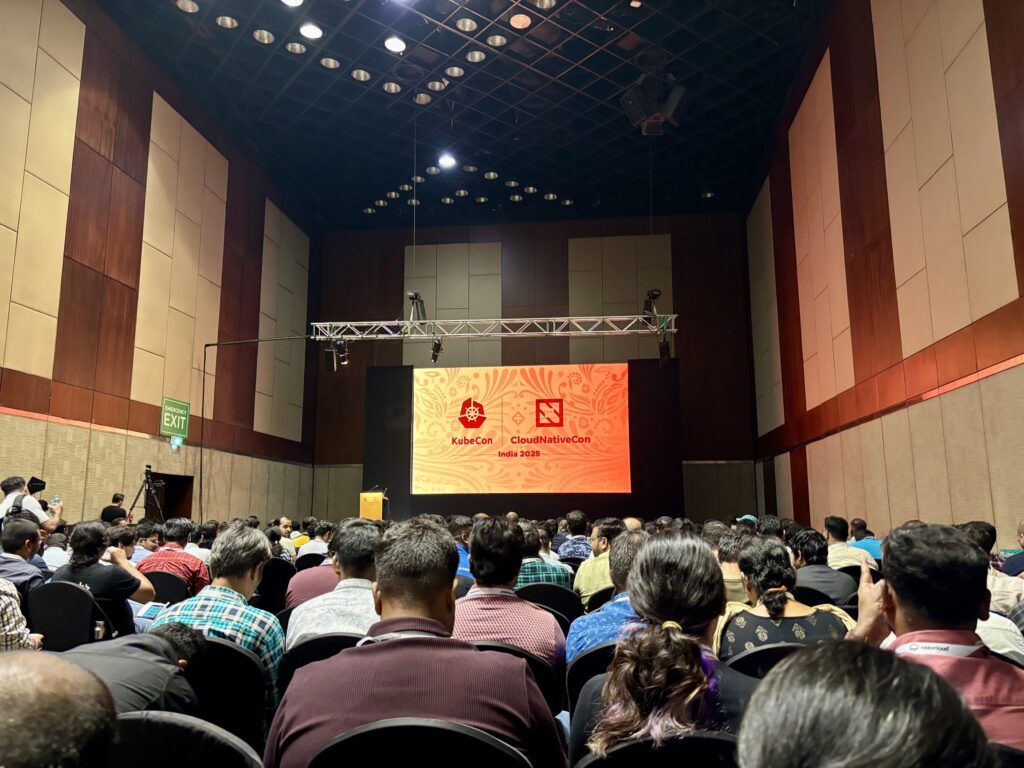
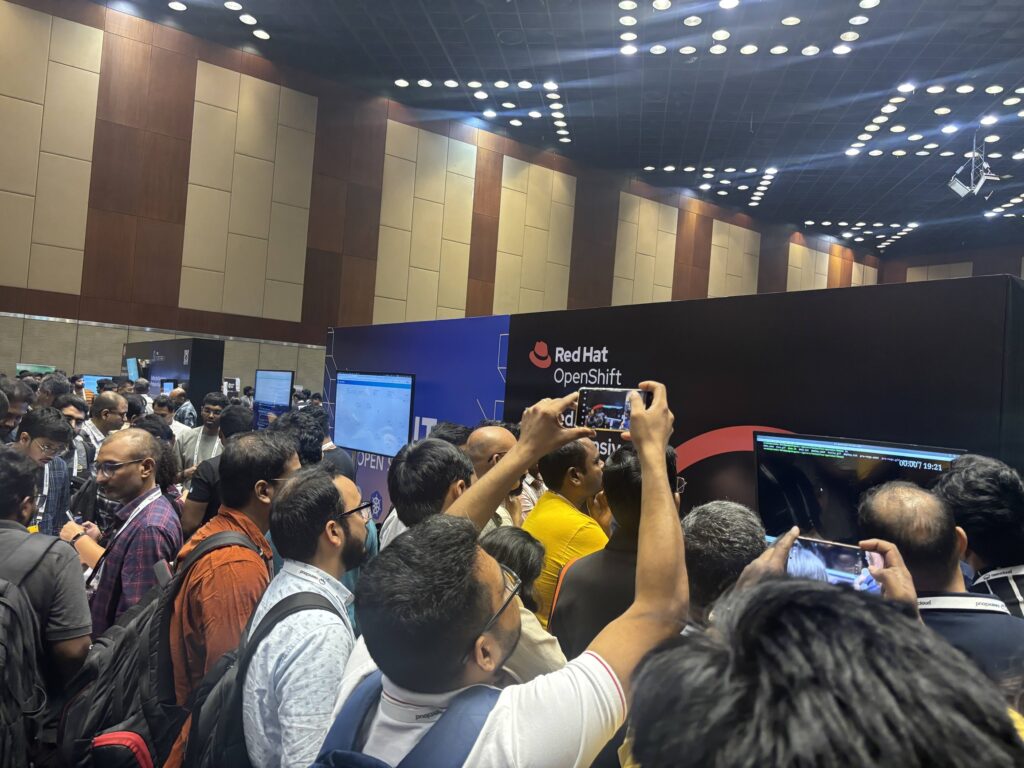
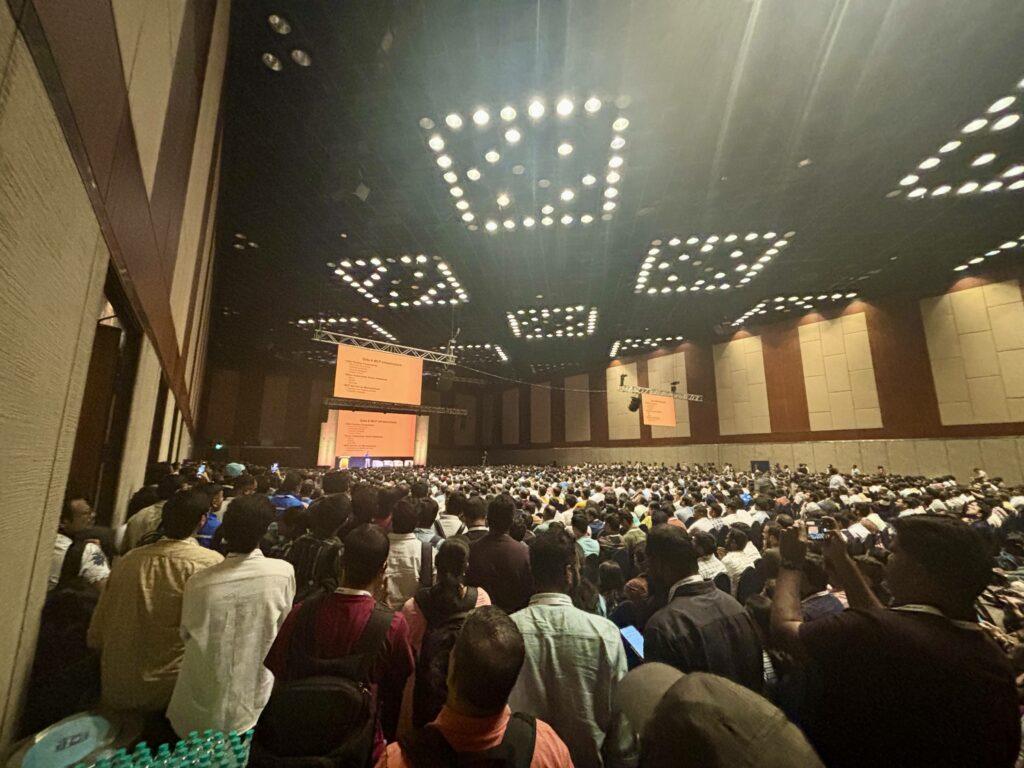
I had the chance to attend KubeCon + CloudNativeCon India this year. Its a two-day technical conference packed with thoughtfully curated keynotes, tech talks, and lightning sessions from the people shaping the Kubernetes ecosystem and the cloud-native world. The event also featured ~30 product/solutions booths showcasing solutions to help organizations with Kubernetes workloads, security, scaling, observability, platform engineering and their AI journey. Before we get into more details, take a look at these key numbers and details:

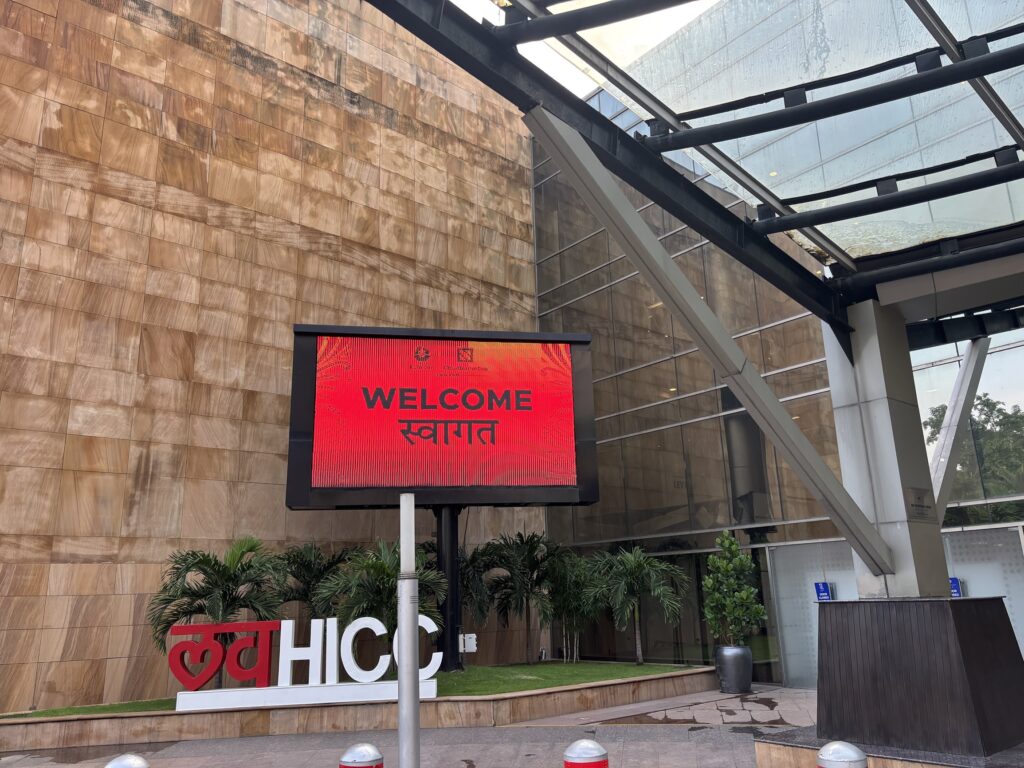
  • Held at Hyderabad International Convention Centre (HICC).
  • Happened on 6-7 August 2025.
  • Sessions
    • 12 Keynote sessions
    • 10 lightning talks
    • 56 Tech sessions on K8s, Observability, Scaling, Security, AI + ML, Platform engineering, etc.
  • Approx ~4000 registrations
  • ~30 product/solutions booth by various companies.
  • The 2026 KubeCon India is announced to be held in Mumbai!
  • Watch this event’s session recordings, available on the CNCF YouTube Channel.
  • Review session slides from speakers who provided them via the event schedule.

With so much on the agenda, it’s very difficult for one person to attend everything. That’s why pre-planning is essential for events of this scale. It was worth creating a schedule focused on the sessions and booths that match your interests. The Sched app made this much easier, helping me build my personal agenda so I wouldn’t miss anything important.

There were these ~30 product/solutions booth at the event (Sorted alphabetically)-

  • Akamai – Akamai Cloud. Simple, Scalable and out of this world.
  • Atlassian – Delivering greatness is impossible alone. Jira. Confluence. Loom. Rovo.
  • AWS – Scalable, Reliable and Secure Kubernetes
  • CAST AI – Kubernetes Automation and Performance
  • Clickhouse + HyperDX – The world’s fastest analytical database
  • Cloudflare
  • Coralogix – Complete Observability, Zero compromises.
  • D E Shaw & Co
  • Digital Ocean
  • Dragonfly – In memory data store. Cut Redis costs by 50%
  • EDB Postgres II by CloudNativePG – Setting the Standard for PostGres in Kubernetes
  • Expedia group – Careers
  • F5 – Optimize, Scale, and Secure Apps in Kubernetes
  • GitHub
  • Gitlab – Develop, secure and deploy software faster
  • Google Cloud
  • Grafana Labs – Open, composable and cost-effective observability.
  • Intel – AI inside for a new Era
  • Kloudfuse – Unified Observability. Your Cloud. Your Control.
  • Kodecloud – Kubernetes learning platform
  • Kong – Kube-native. Platform-forward.
  • Last9 – Ship fast. triage faster.
  • Learning Lounge CNCF – The Linux Foundation Education
  • Microsoft Azure – Achieve more with Azure hosted Kubernetes
  • Nudgebee – AI-Agentic Assistants. Troubleshooting. FinOps. CloudOps.
  • Nutanix – Kubernetes. Virtualization. Data. Anywhere.
  • PerfectScale by doit – Autonomous Kubernetes. Optimization and Governance.
  • RedHat OpenShift
  • ScyllaDB – Predictable Performance at Scale – Anywhere
  • Sonatype – Scalable Artifact Management
  • vmware – Kubernetes Made Simpler, More Flexible and Secure.
  • VULTR – Global cloud infrastructureand manage Kubernetes for AI-native applications

My experience

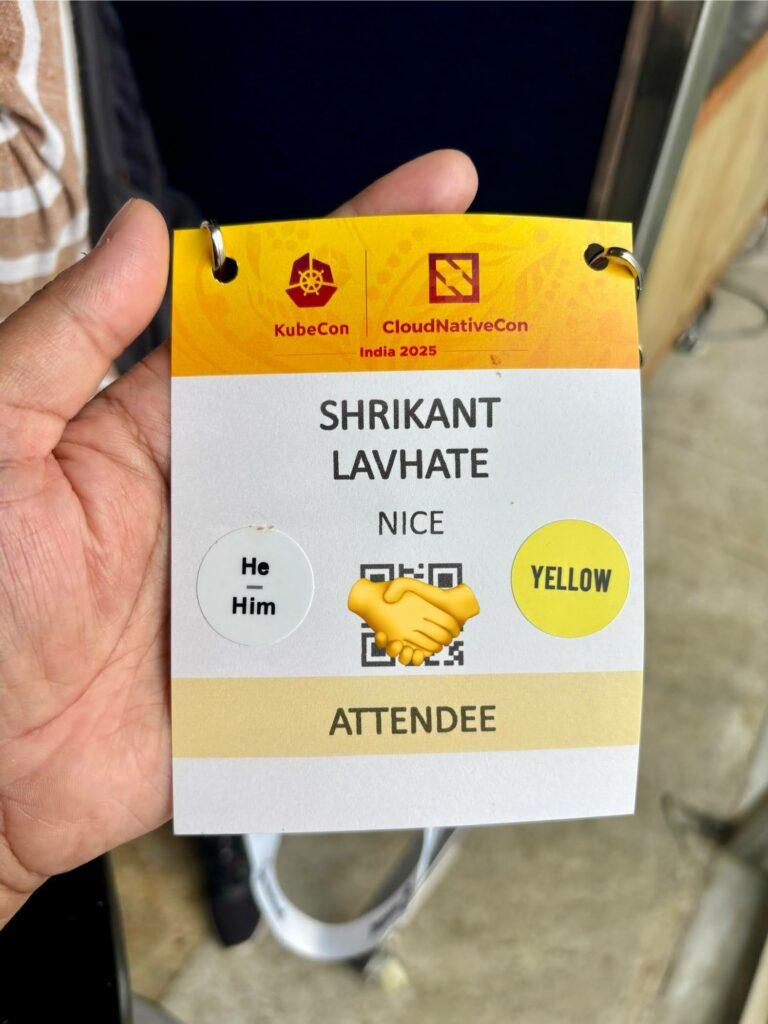
I traveled with my team to attend the event, and ignoring the travel fatigue, we made it to HICC by 8 AM for the check-in formalities. We were ready after security checks done and we received our event badges. The venue welcomed us with tea, coffee, and cookies – a much-needed warm-up before a day packed with technical deep dives.

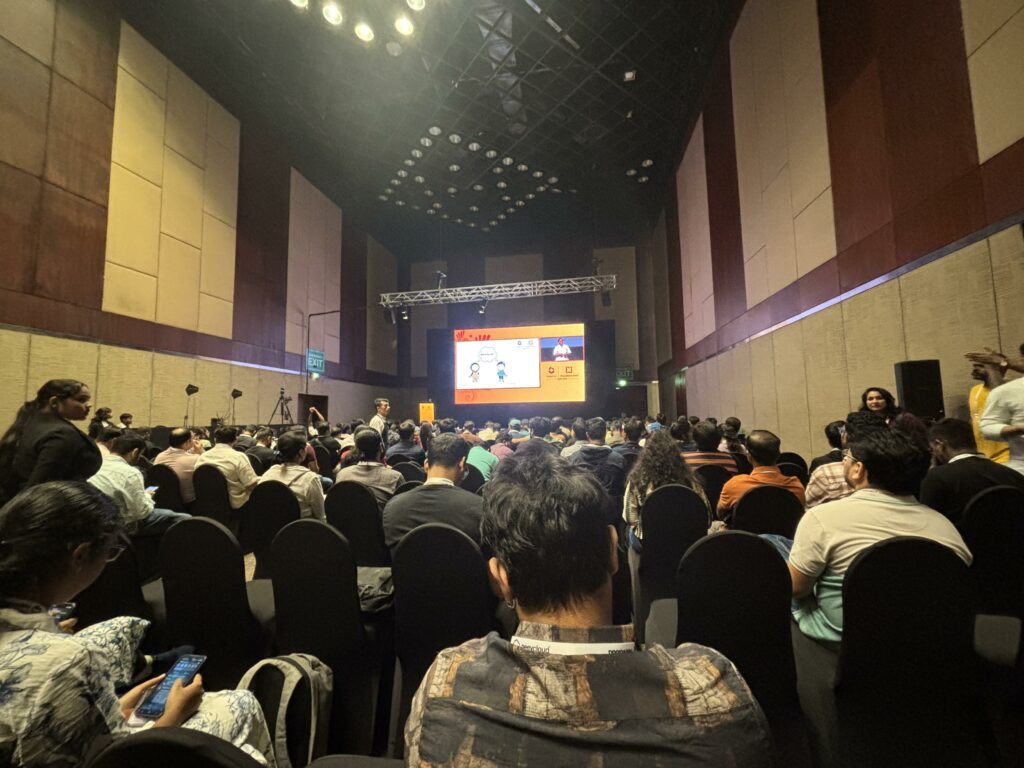
By 9:30, as per the agenda, the keynote sessions started. The crowd was so massive that the main hall quickly filled up, but crew arranged adjacent halls with big screens for live streaming. We settled into one of those adjacent halls, but due to some technical glitches with the screen and audio, we decided to head back to the main hall and stand along the sides just to catch the keynotes live. After an hour of inspiring talks (and sore legs :D), we stepped out for a break and then dove into exploring the product and solution booths.

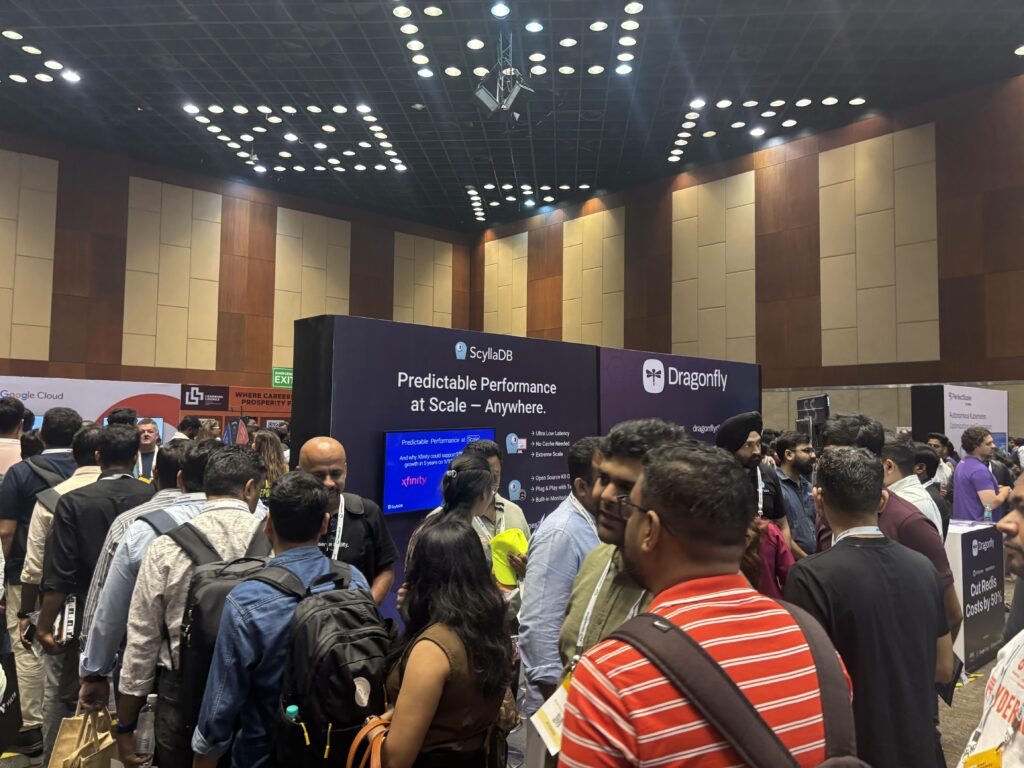
The booths were sparkling with energy! Attendees deep in conversations with booth teams, exploring new features and solutions – it was a energetic sight! It was great to see fresh graduates in the mix, already well-versed in cloud technologies. The enthusiasm was contagious, and of course, no developer conference is complete without a shower of freebies and laptop stickers. We do collected a healthy stash!

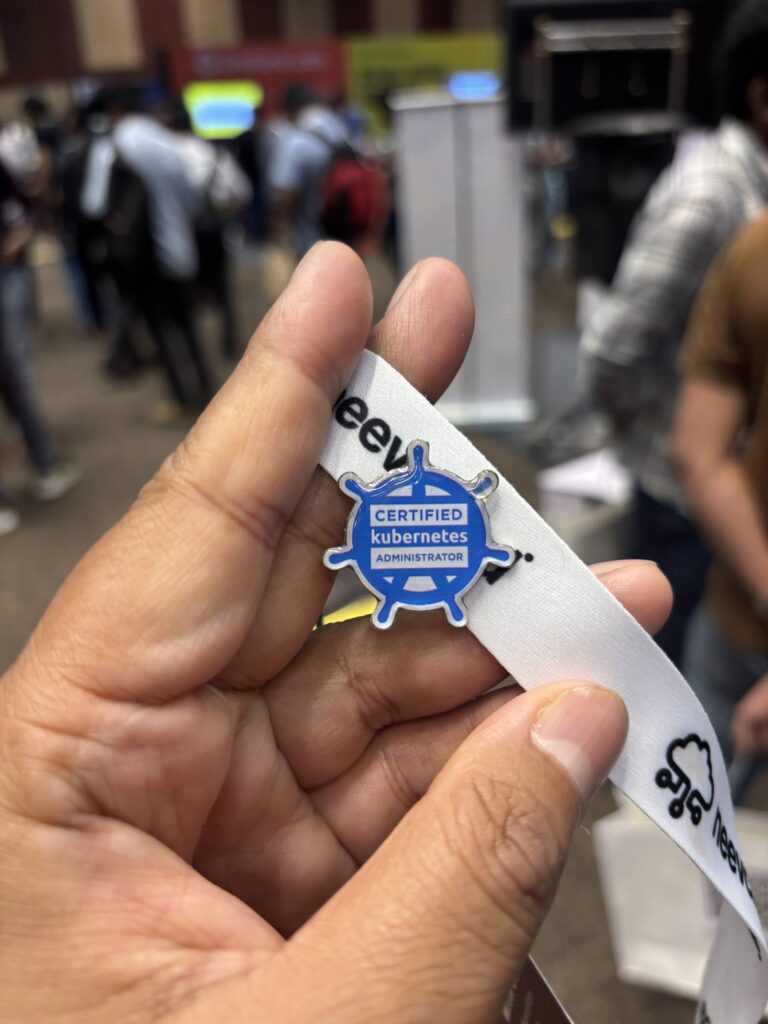
The iconic “Kubestronauts” blue jackets were turning heads throughout the venue. It’s a title one can earn by completing five Kubernetes and cloud-native certifications, a badge of honor that carries serious weight in the Kubernetes world today. Seeing a few Kubestronauts proudly sporting those jackets was truly inspiring!

We split up to cover more ground, each visiting different booths. My own highlights are the insightful discussions I had at the AWS and Nudgebee booths. Both offered interesting perspectives and solutions worth exploring further.

The organizers smartly arranged lunch across multiple dining designated areas, which helped spread out the crowd and made it possible for attendees to enjoy a peaceful, crowd-free meal.

We contiunued the second day with similar agenda of attending sessions and booths gathering every possible bit of the information that could help us keeping tab of the Cloud Native and Kubernetes world and industry progress in those domains. ArgoCD scaling, Platform Engineering, EKS Auto mode, EKS dashboards, Observability, AI integration for troubelshooting and Ops to name a few.

I also ran into a former colleague and reconnected with some contacts from AWS I had worked with in the past during the event. Also, got to see some open source community leaders, some well known personalities from Kubernetes/Cloud world in person. These technical conferences are they best way to network and socialize!

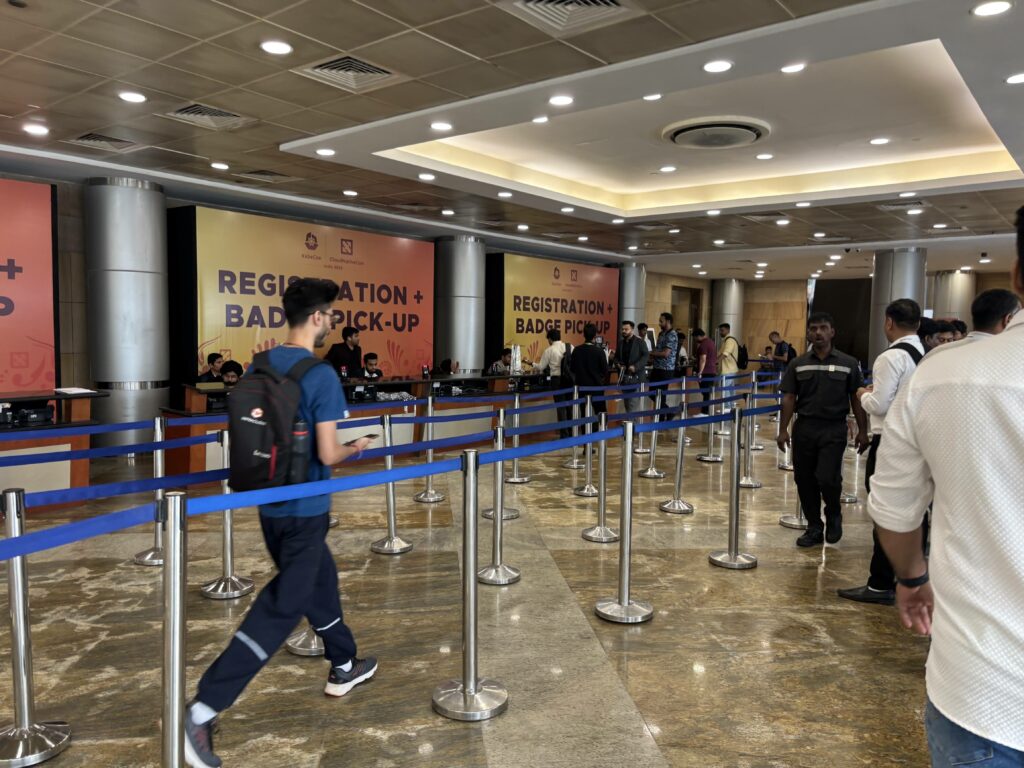
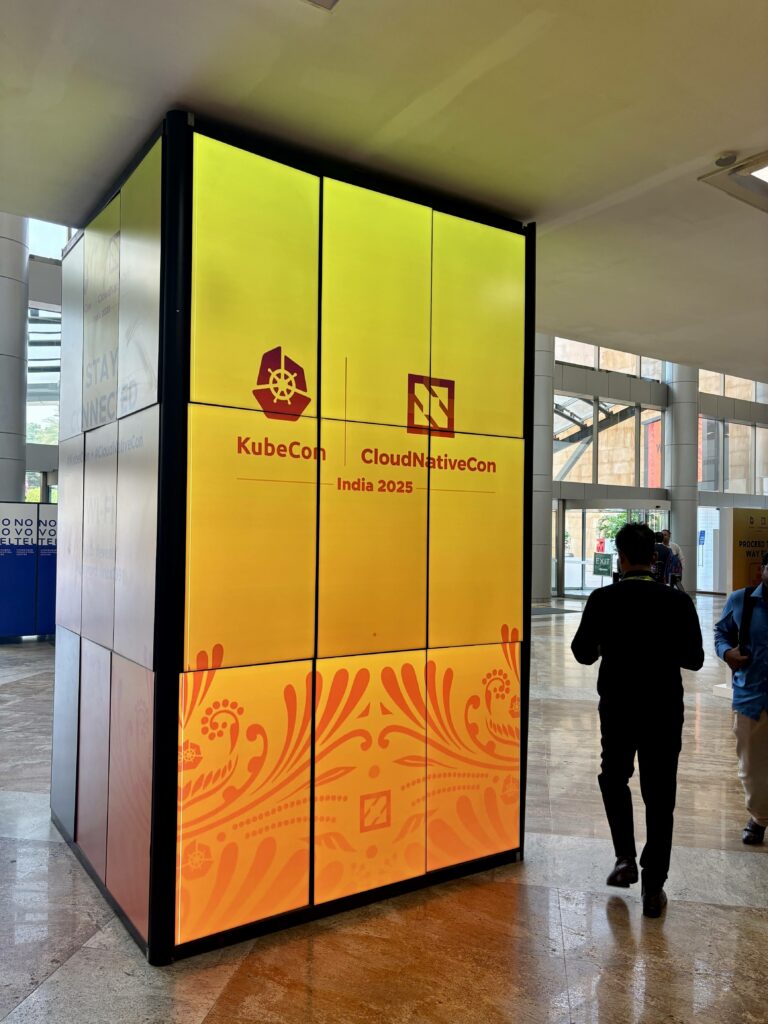
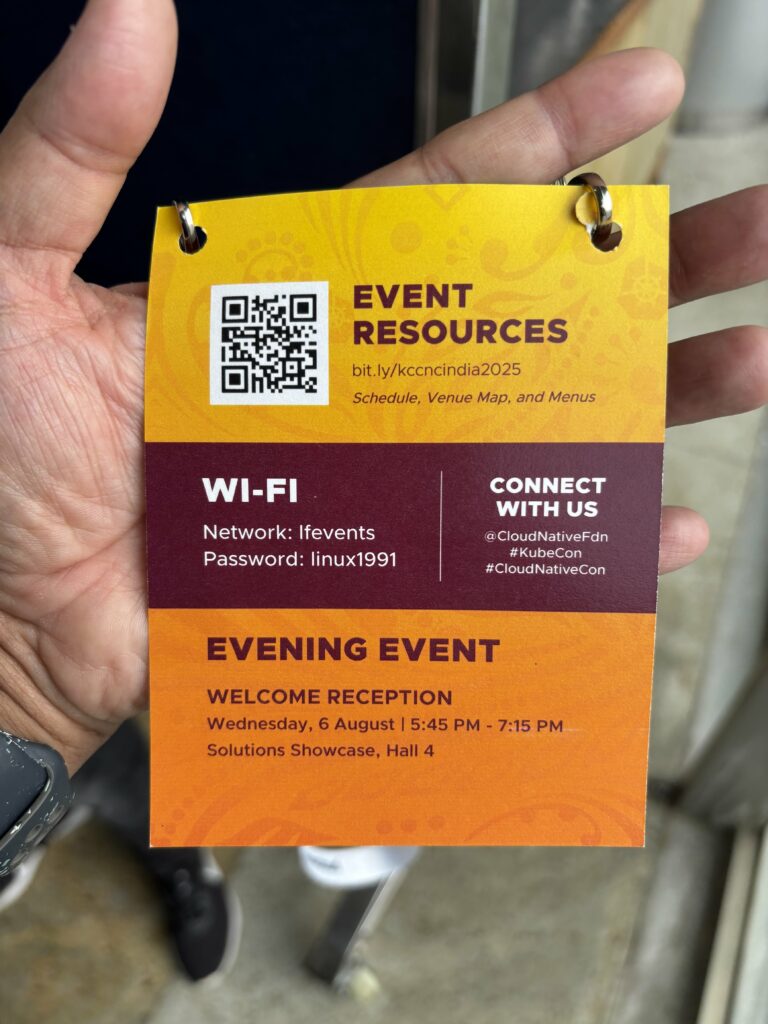
A Peek into the Event

Reflections on AWS Summit Mumbai 2025

I had the opportunity to attend the AWS Summit Mumbai 2025 on June 19th. In this post, I’ll be sharing my insights and reflections from the event.

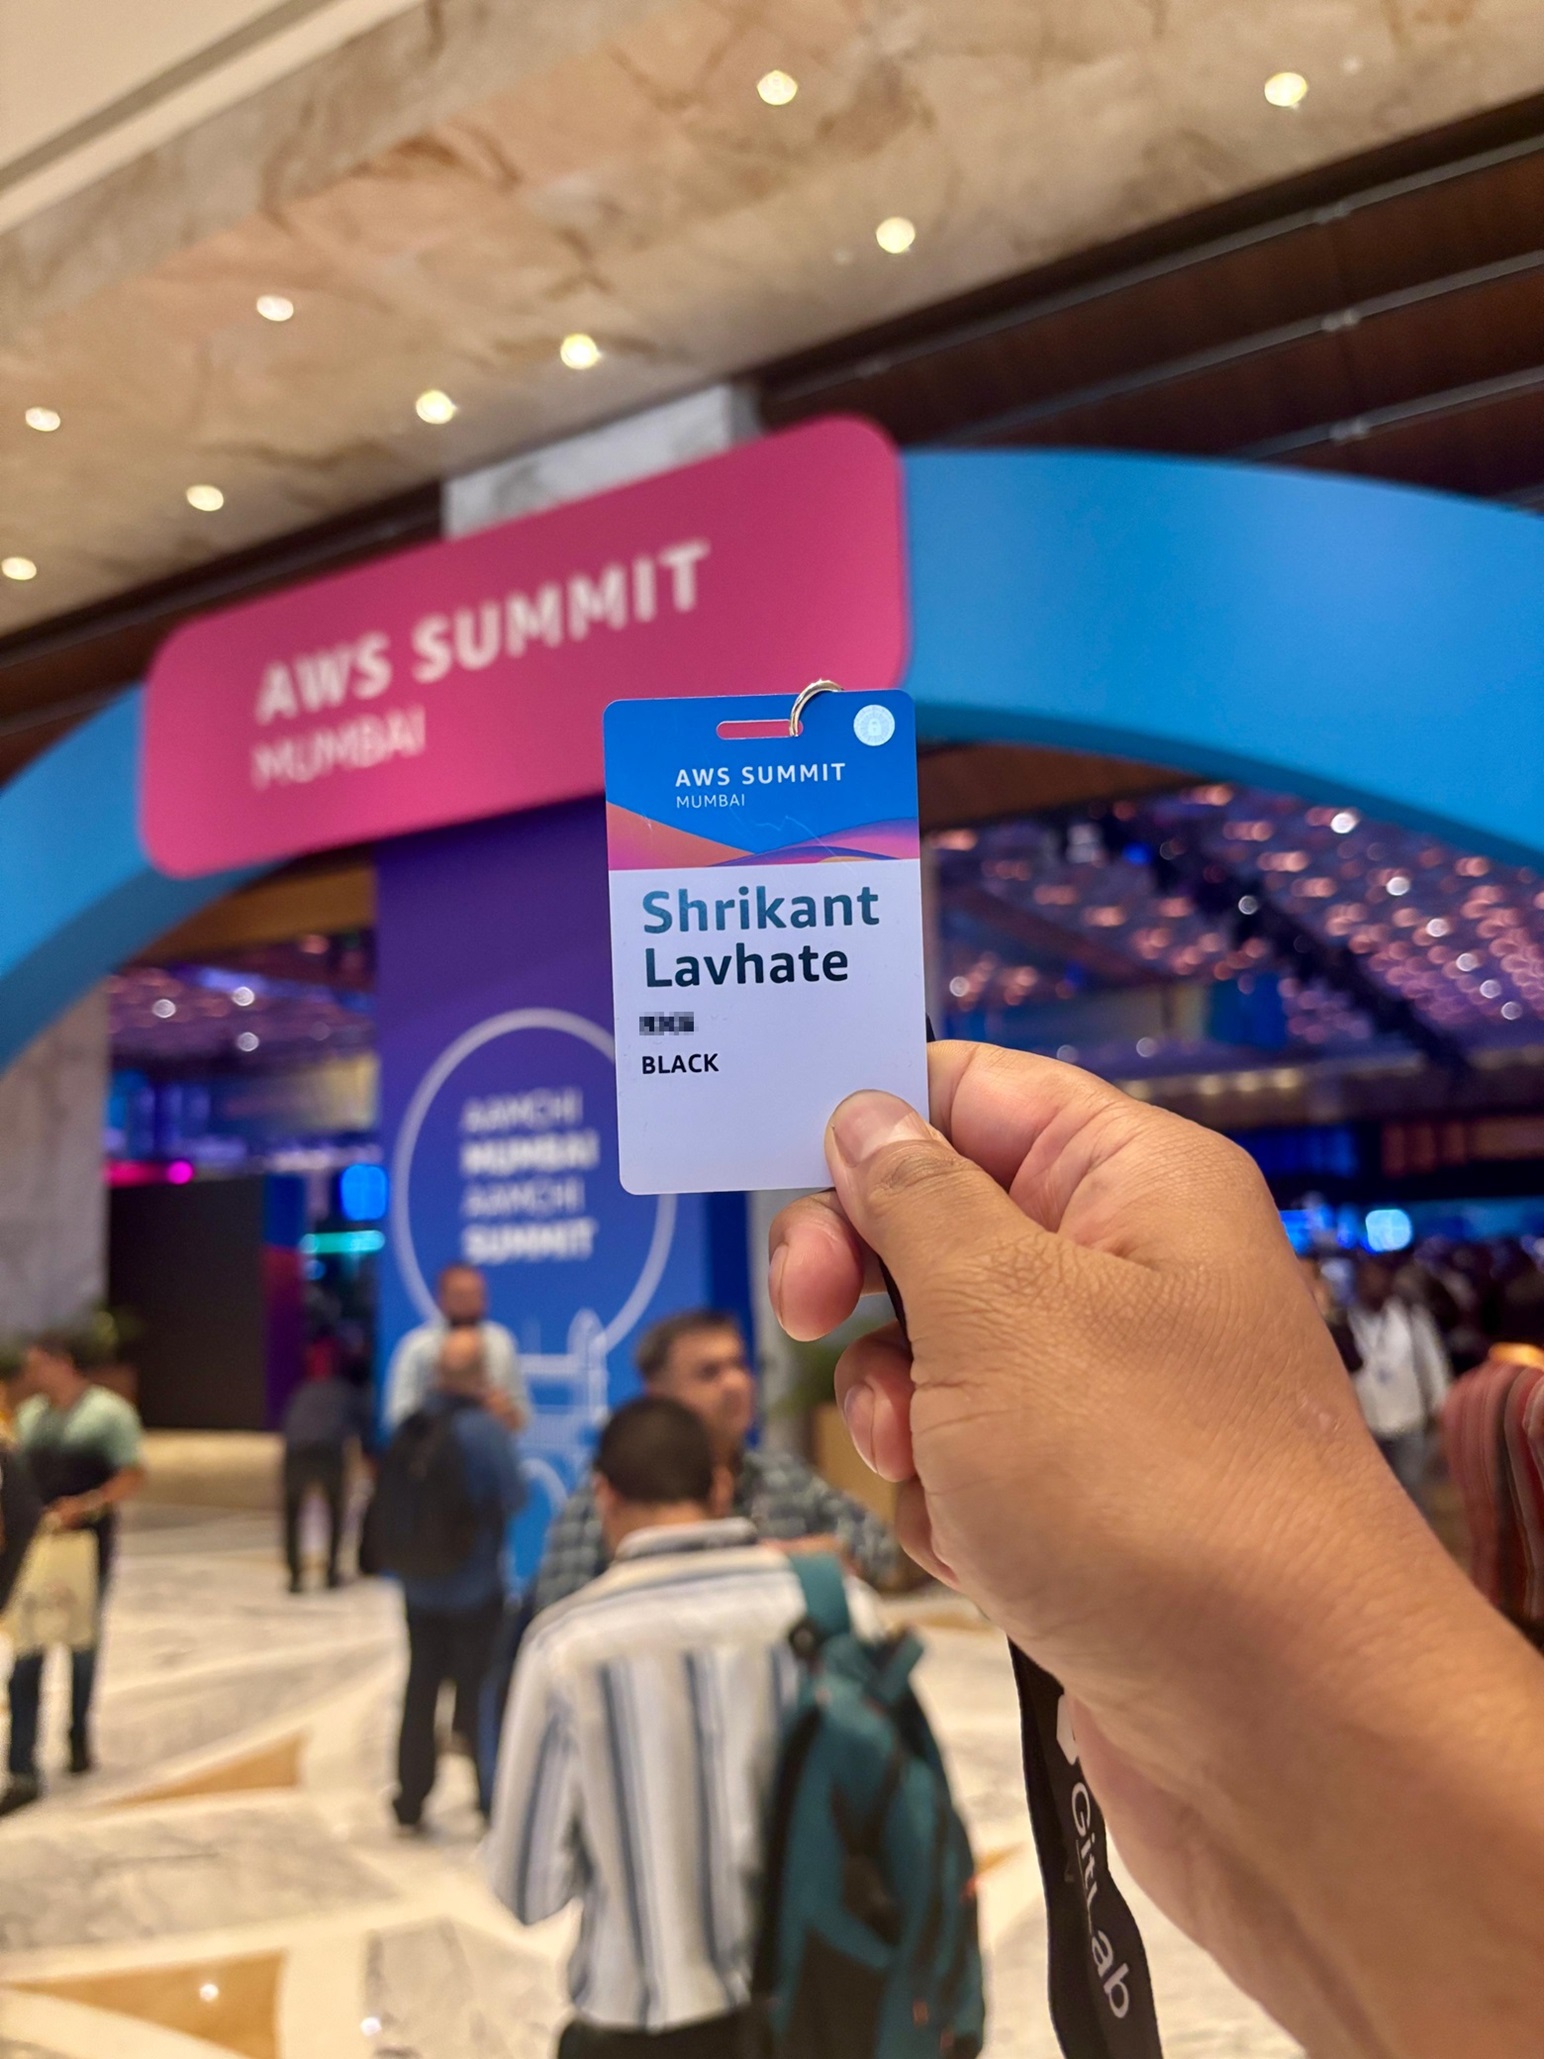
AWS Summit,Mumbai!

AWS Summit is not a AWS re:Invent!

The AWS Summit is a regional tech conference held multiple times a year, designed to showcase majorly customer stories, real-world use cases, product applications, and technical journeys powered by AWS. It’s focused on knowledge sharing and community engagement rather than major product announcements.

In contrast, AWS re:Invent is AWS’s global, annual flagship event. It’s where the company unveils new services, features, and products, alongside deep-dive technical sessions, training, and certification opportunities.

So, if you’re attending an AWS Summit, don’t expect groundbreaking announcements. Instead, think of it as a community event focused on learning, networking, and exchanging experiences with the local digital and tech ecosystem.

AWS Summit Mumbai 2025

AWS Summit Mumbai 2025 was focused on sharing the stories and products that harnesses the power of Cloud Computing and AI for accelerating digital transforming journey of India. Yes, a lot of AI was in the air!

It kicked off with the Keybote from AWS leaders: Sandeep Dutta – President – AWS India and South Asia and Ganapathy Krishnamoorthy VP – Databases – AWS. The keynote also included the the talks from Industry leaders: Dr. Tapan Sahoo (Head of Digital Enterprise and Information & Cyber Security, Maruti Suzuki India) and Rajesh Chandiramani (CEO, Comviva).

Keynote was followed by nearly 40+ breakout sessions in various technologies like databases, AI, observability, FinTech, etc. that showcased how industry in India is leveraging the power of AWS and AI to shape their future.These sessions were categorized into 6 tracks :

  • Building for Scale
  • Generative AI on AWS
  • Migration and modernization
  • AWS for Data
  • Security, compliance & resilience
  • Innovate with AWS Partners

The experiences at the venue included builders zone (offering hands-on to latest AWS services), Industry hub (business tailored, cloud native solution products), Business innovation hubs (convergence point for organizations), AWS Game Day (2-hours hackethon mainely focused on usage of AWS AI services) and AI Hub (Hands-on to AWS AI services).

My experience at AWS Summit Mumbai 2025

The event was really well organized and took place at the impressive Jio World Convention Centre in Mumbai. The venue itself was top-notch, and the food—breakfast, lunch, and high tea—was genuinely delicious.

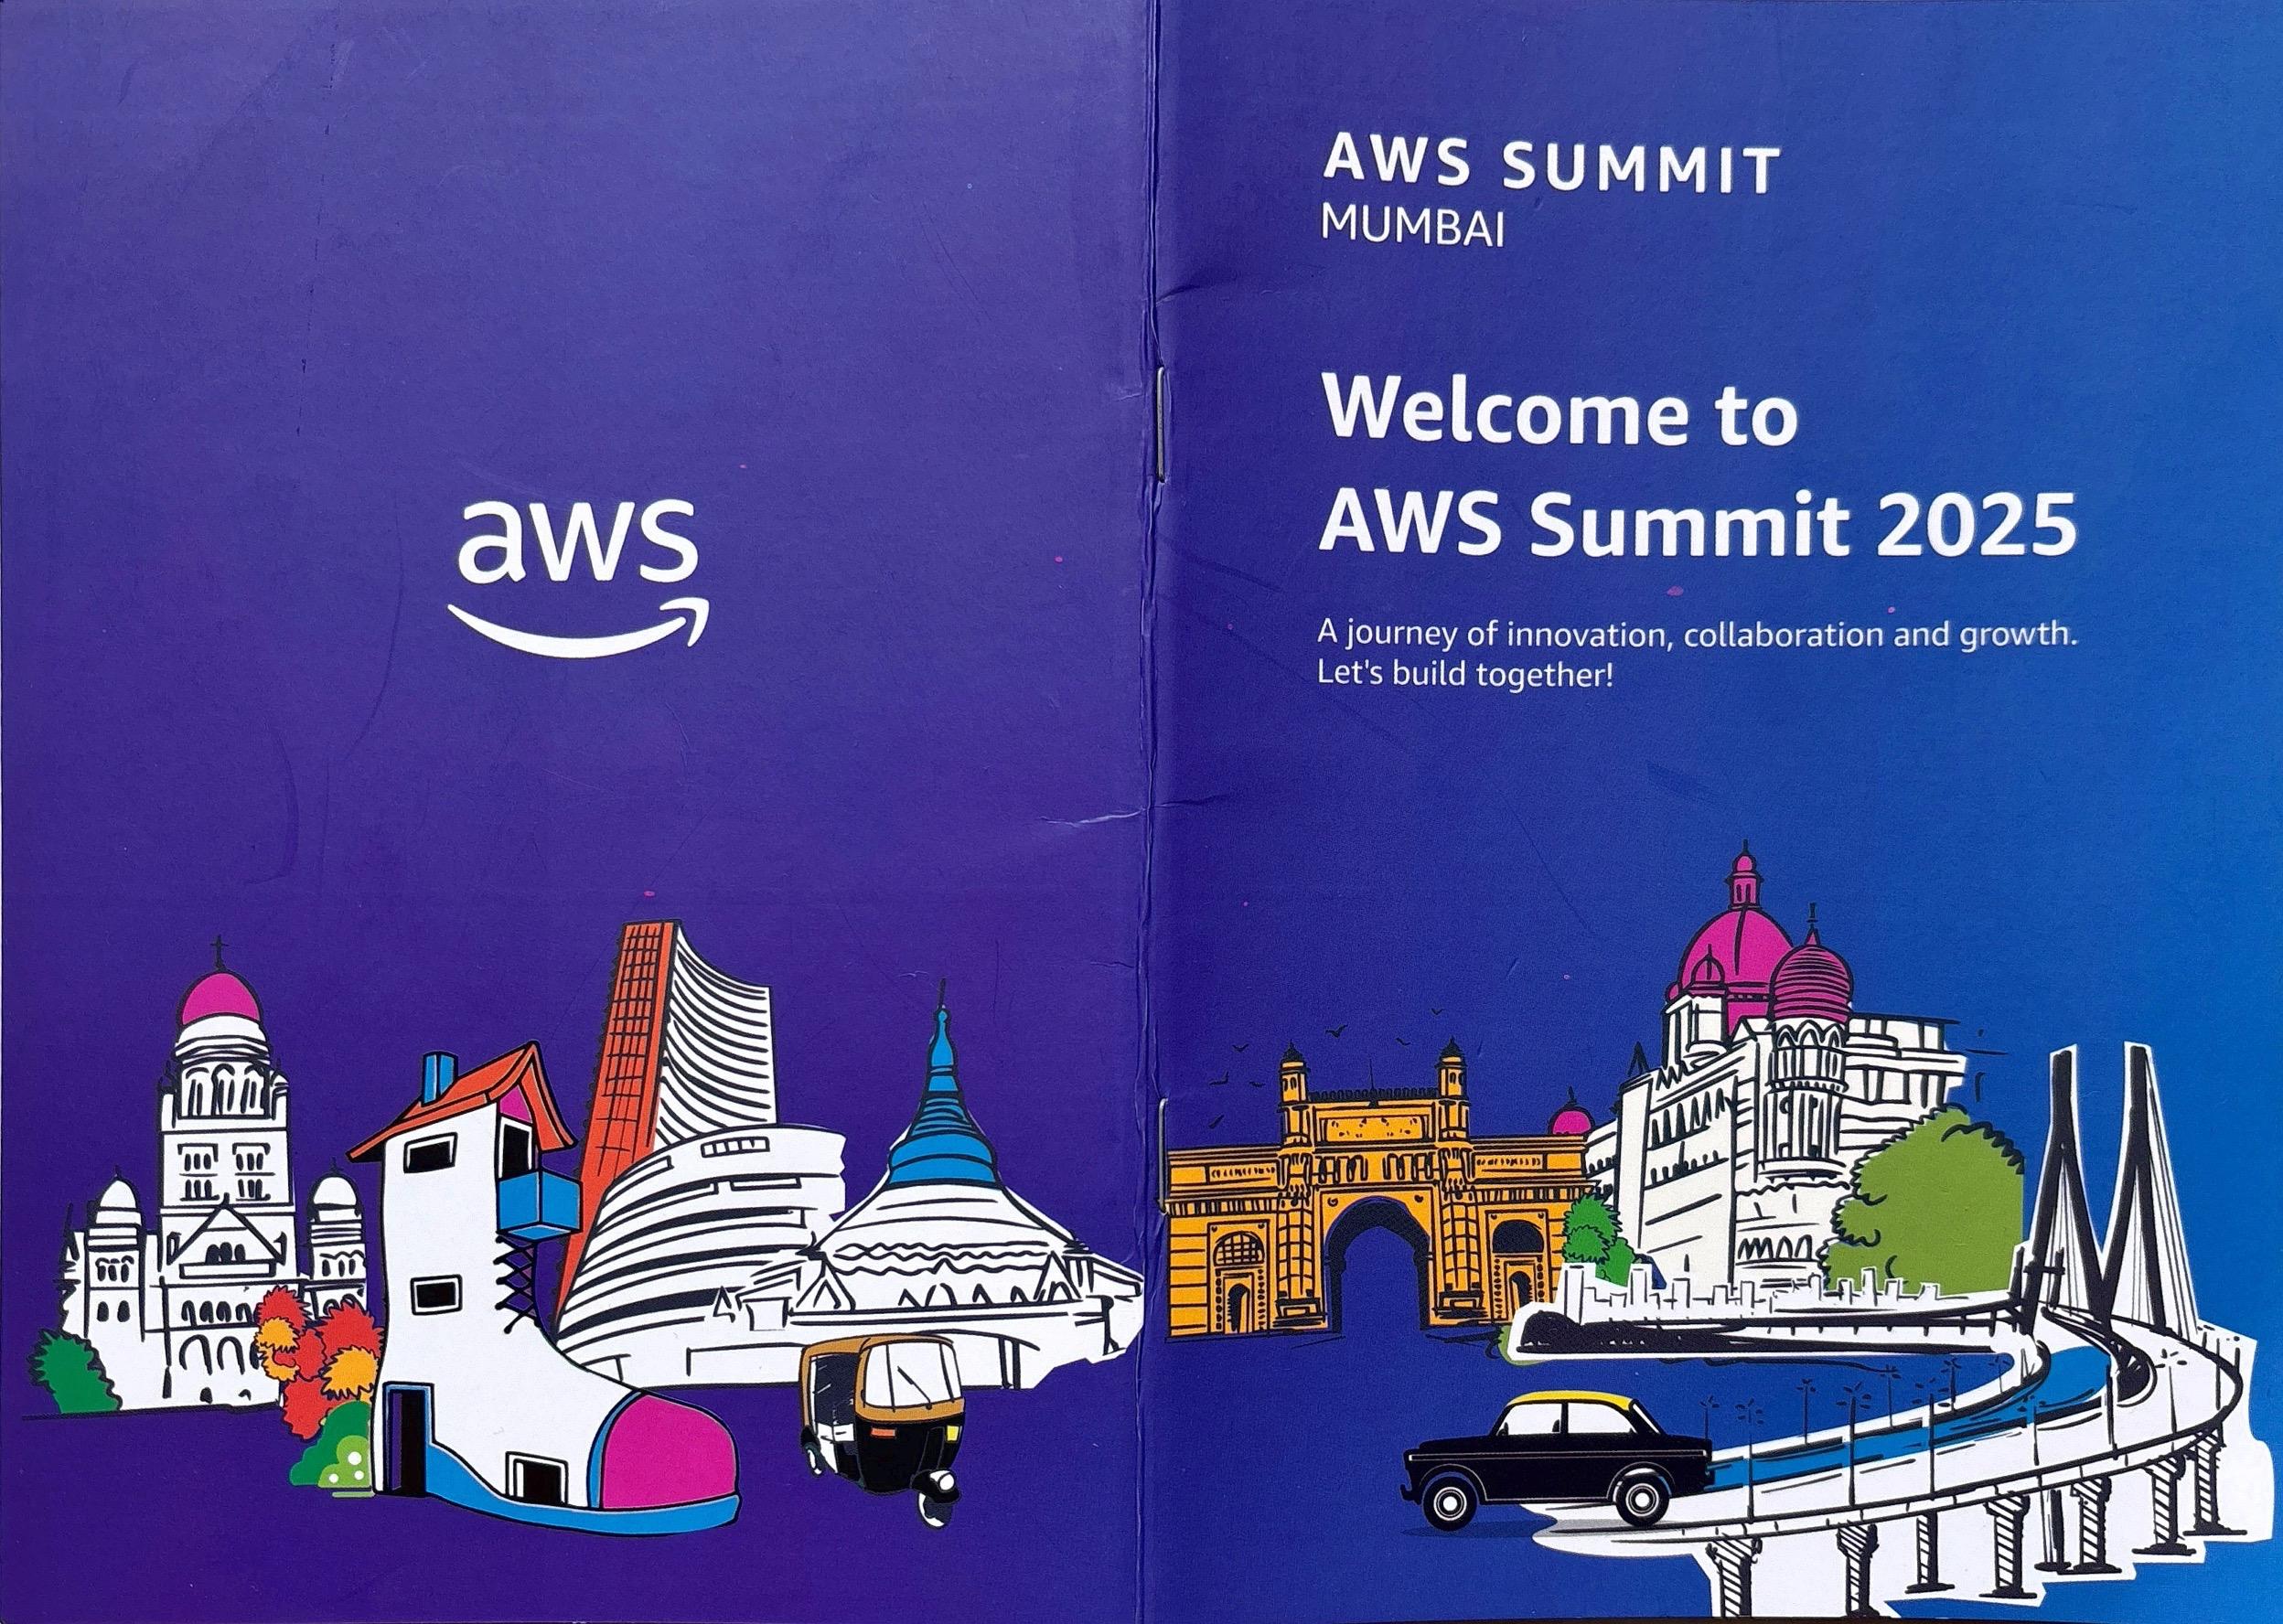
Even though the space is huge, the number of attendees made it feel a bit crowded at times. There were some cool photo spots set up that captured the spirit of Mumbai, which added a nice local vibe to the event.

The breakout sessions were intense—over 40 sessions packed into just three hours (1:30 PM to 4:30 PM)! Even with a plan in place, it was tough to jump from one session to another, especially with sessions happening in different halls. You’d almost always miss the first few minutes of the next session. A 5-minute buffer between sessions would’ve made a big difference.

There wasn’t much time left for networking or checking out the booths unless you sacrificed a bit of your lunch or break time. That said, the overall vibe was electric—full of tech buzz, especially around AI. I also ran into a few former colleagues, which was a really nice, nostalgic surprise!

A peek into the event

Efficient & Ergonomic: A Look Inside My Home Office Setup

With the rise of remote work, having a well-equipped home office isn’t just a luxury—it’s a necessity. Over the past year, I’ve fine-tuned my setup to strike the perfect balance between productivity, ergonomics, and tech aesthetics.

Instead of overloading the space with gear, I’ve focused on what actually improves my daily workflow. Each item in my setup has been carefully chosen for a balance of performance, comfort, and reliability. From a dual-monitor arrangement and a wireless mechanical keyboard to ergonomic accessories and clear audio gear, these tools help me stay efficient and comfortable throughout the day.

Here’s a quick look at the core gadgets that make up my current setup.

Home Office Setup

Home Office Gear List

A home office is more than just a desk and a chair—it’s the environment that supports your focus and flow. With the right tools in place, you can turn any corner of your home into a productivity powerhouse. I hope this breakdown of my setup helps inspire yours. Have questions or want to share your own workspace? Drop a comment below—I’d love to hear from you!

Load Balancing between two ISPs with TP-Link ER605

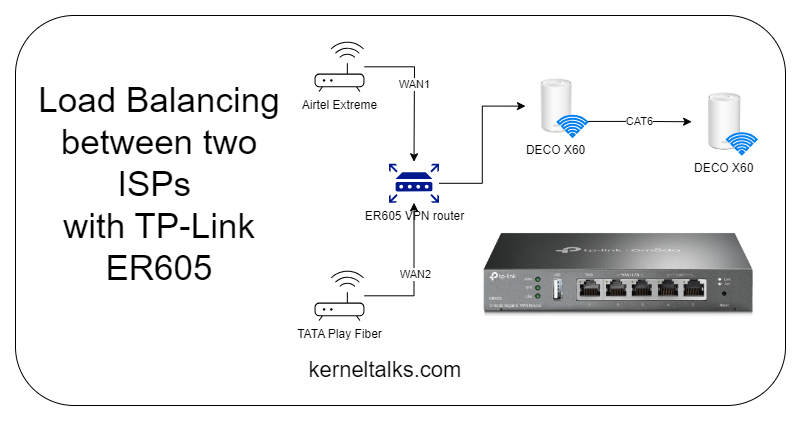
In this post, we will walk you through the procedure to configure two ISPs i.e. Airtel Extreme and TATA Play Fiber in load balancing configuration with tp-link ER605 router for high availability of internet at home/small business.

Pre-requisites

  1. Two active ISP lines (We are discussing here Airtel Extreme and TATA Play Fiber)
  2. Both ISP routers in Bridge mode acting as a passthrough.
  3. tp-link ER604 VPN Router (Load balancer)

Before we proceed, Airtel and TATA router’s should be configured in a Bridge mode. We explained how to enable bridge mode in Airtel router here. Please follow below procedure for TATA Play Fiber router.

How to enable Bridge mode on TATA Fiber router

  1. Reach out to TATA engineering team through customer care for below tasks –
    • Enabling bridge mode for your router from backend.
    • Obtain admin credentials to log into the router
    • You should have PPPoE credentials on your email (TATA generally sends them when you receive new connection). If not, then obtain them as well from the engineering team.
  2. Please be noted that enabling bridge mode from backend by TATA engineering team is a crucial step for LAN bridge configuration.
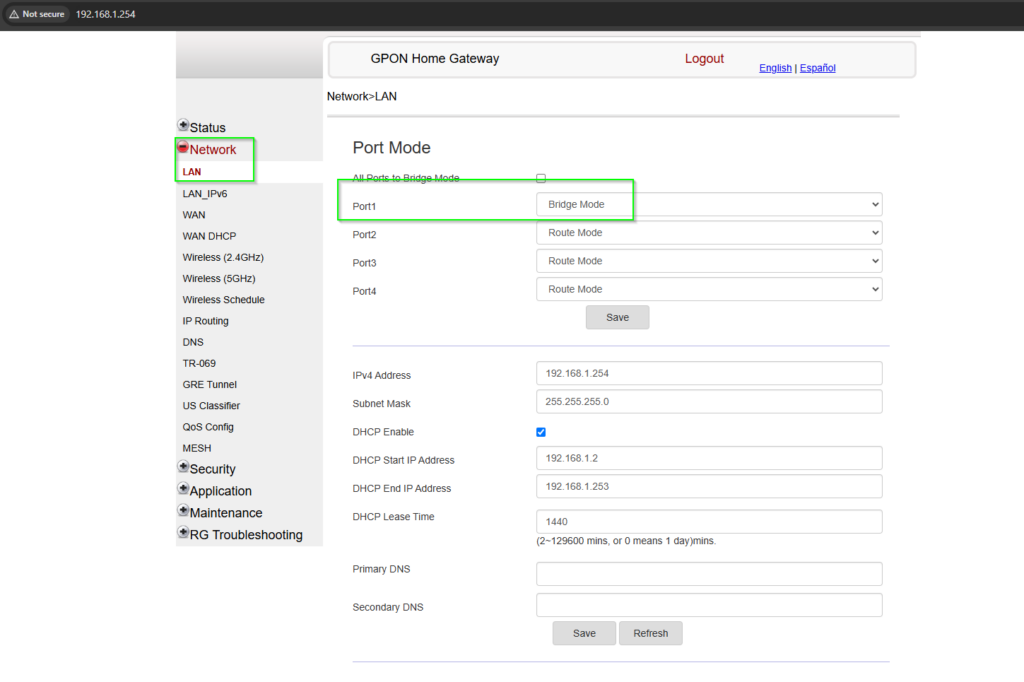
  3. Once both requests are completed, log into the router using the obtained credentials and configure one of the LAN port with bridge.
Enabling bridge mode on TATA router

Additionally, you can disable the WiFi networks on this router as your home/office will be powered by the network created by tp-link ER605 router for high availability.

At this point in time, you should have both ISP’s i.e. Airtel and TATA’s routers configured in bridge mode. Let’s look at the tp-link ER605 configurations now.

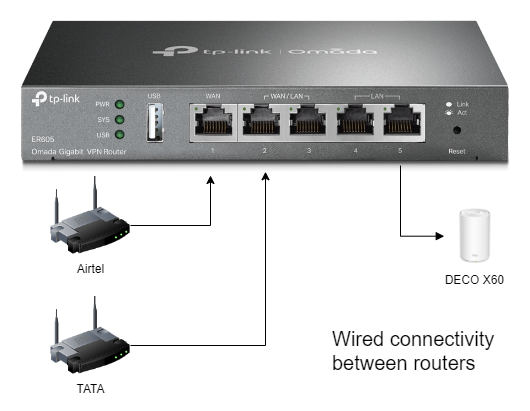
Wired connectivity between routers

Now, its time to hookup ISP routers to tp-link ER605.

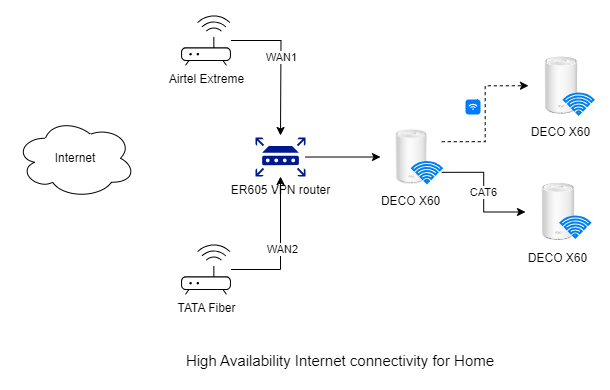
  • PORT 1: Primary WAN. A CAT6 cable running from Airtel router LAN port to this.
  • PORT 2: Secondary WAN. A CAT6 from TATA router LAN port to this.
  • Ensure ports configured in Bridge mode on ISP routers are used for this wired connecctivity.
  • PORT 3/4/5: Connected to WiFi Access Point i.e. to extend ER605 network over WiFi. I have X60 mesh network in AP mode.

ER605 configurations

Connect a laptop/desktop to ER605 using ethernet cable to any of the remaining port. Start router by plugging it in the power supply. Log into ER605 console at http://192.168.0.1/

On very first login it will prompt for setting up the username and password. Proceed with on screen instruction to setup your account. Once logged in –

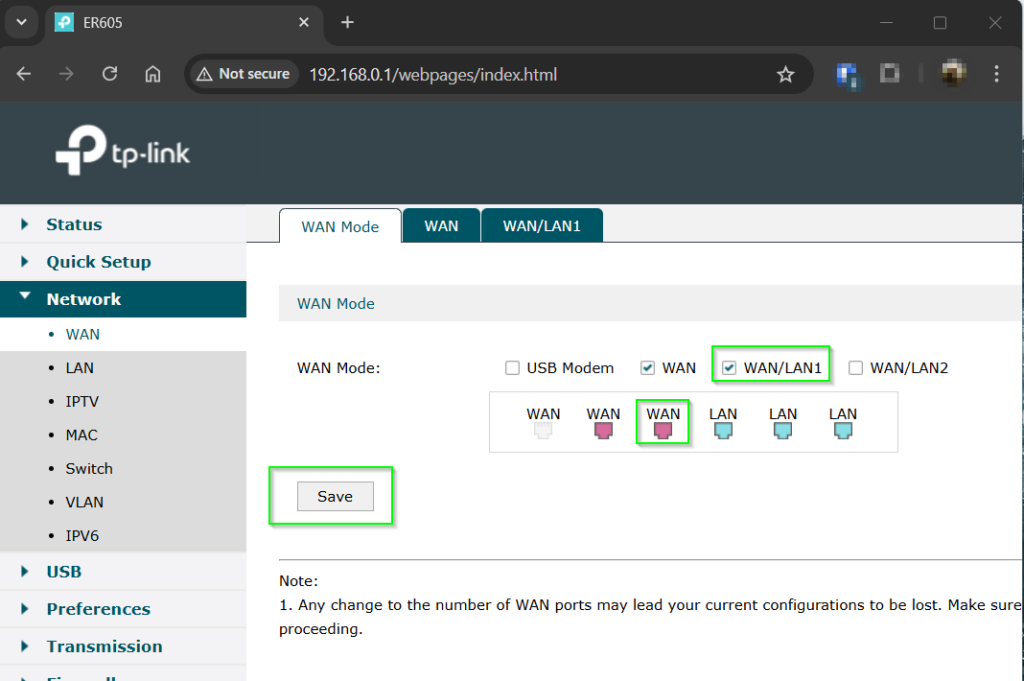
  • Navigate to the Network > WAN > WAN Mode
  • Select WAN/LAN1 to enable PORT2 for WAN connectivity and click Save
PORT WAN config
  • The router should restart to apply this configuration.
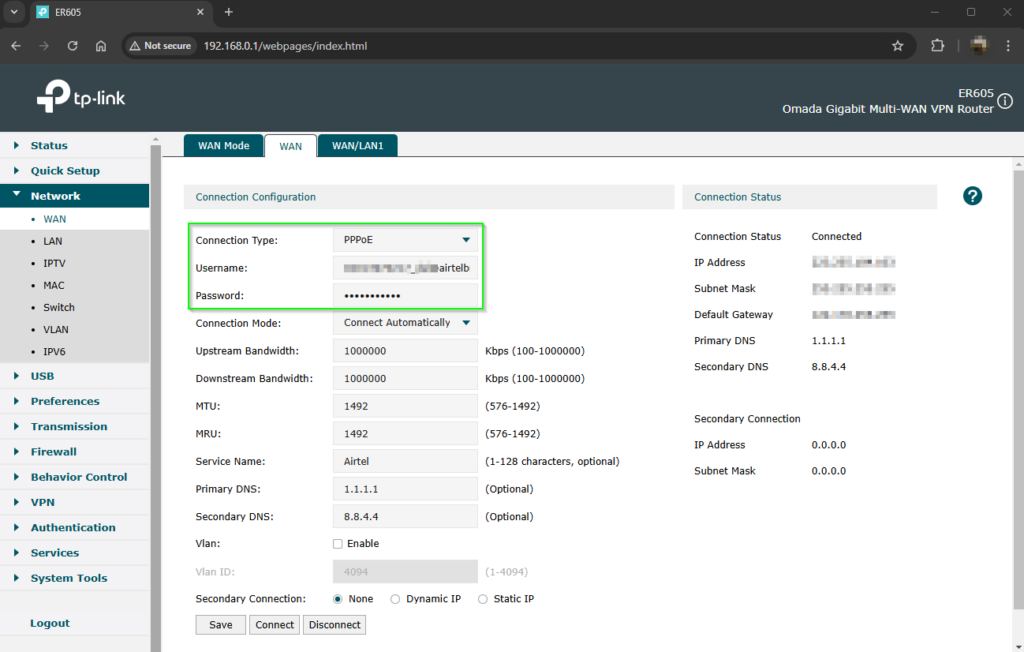
  • After restart, log in and navigate to Network > WAN > WAN
  • Punch in connection configs for the ISP i.e. plugged into first WAN PORT. In our case, Airtel Extreme PPPoE configs.
  • Once saved, it will automatically try to connect and connection status will be updated in the right panel.
  • There are couple of options that you can configure here as bandwidth and DNS servers.
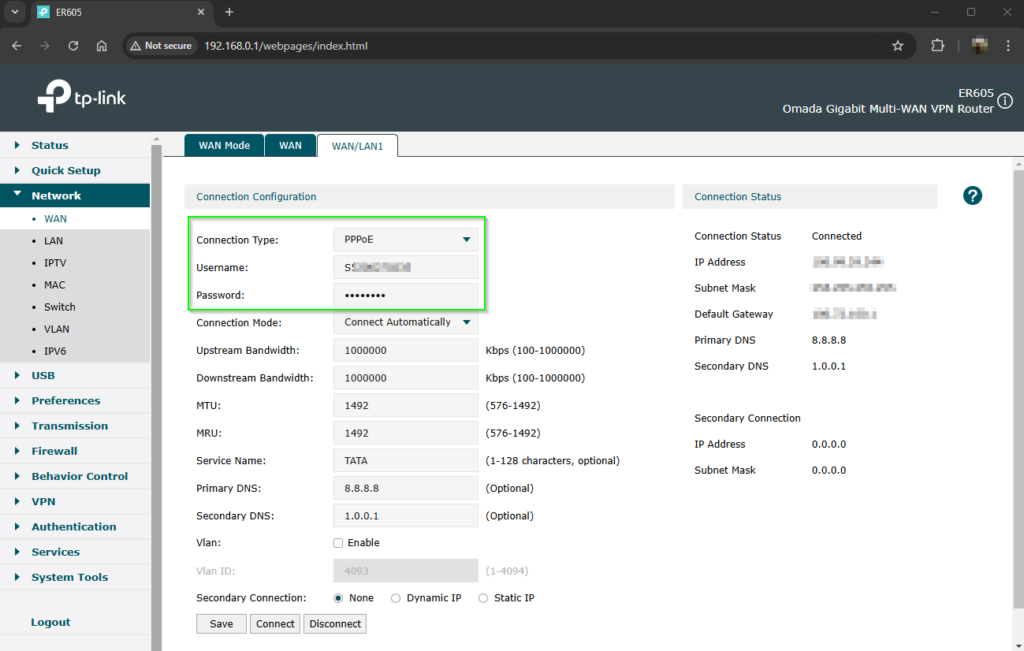
  • Navigate to Network > WAN > WAN/LAN1
  • Configure the second ISP i.e. router plugged into PORT2 of the ER605. In our case its TATA Fiber.
  • Both WAN should get connected. Verify in the Connection Status.
  • Notice, how I am making use of 4 DNS servers (a pair in each WAN from different companies)
    • WAN1: 1.1.1.1 (Cloudflare) and 8.8.4.4 (Google)
    • WAN2: 8.8.88 (Google) and 1.0.0.1 (Cloudflare)
  • At this point, Internet is made available from two WANs in the network of ER605. Rest of the LAN ports can be used for internet consumers.
  • I am extending this network on my WiFi Mesh DECO system which is configured in AP mode. Hence, all my home wifi clients are now consuming bandwidth from two differnt ISPs and having a very highly available internet connectivity!
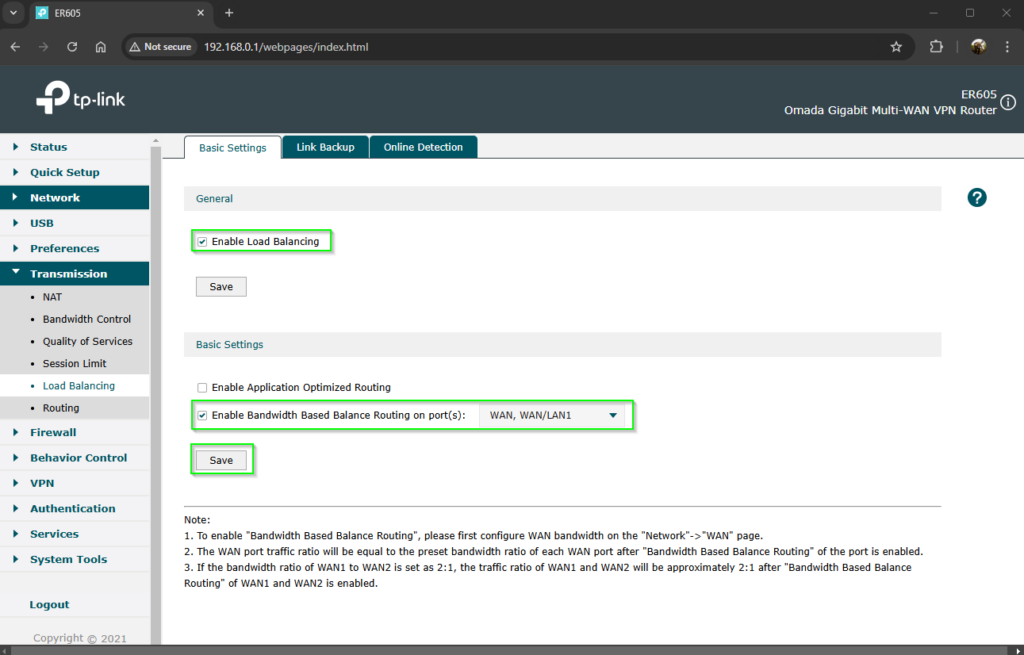
  • Navigate to Transmission > Load Balancing
  • Ensure Enable Load Balancing is selected.
  • Select both WAN under Enable Bandwidth Based Balance Routing on ports. It will ensure bandwidth usages will be propertionate between both the WANs. If there is bandwidth up/down difference between WANs, ensure you configure them accordingly in previous connection configurations. So that, bandwith usages will be handeled accordingly.

Load balancing ensures that if one of the WAN goes down (ISP downtime) then all internet traffic is routed through other WAN hence achieving high availability of internet.

Bandwidth-based routing ensures that both ISPs’ bandwidths are fully utilized, preventing the any ISP from going unutilized and costing rentals unnecessarily.

Result!

The highly available Internet services on home mesh WiFi!

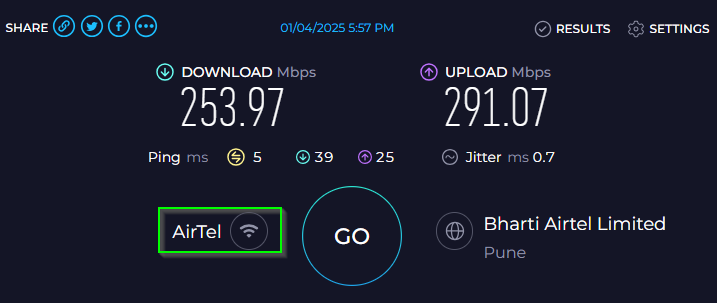
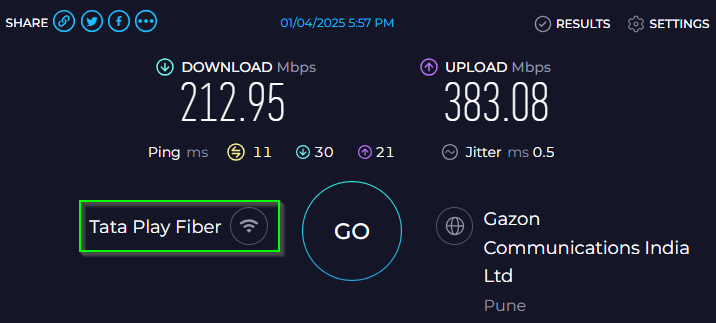
The speedtest of this setup should be carried out on two different devices ensuring they are going out on internet through different WANs. Execute the speed test at a same time and test results should show full bandwidth of respective ISPs for both devices. In a nutshell, at any given point in time total of both bandwidth’s is available.

ER605 is a powerful device for home use and there are many different things that can be configured. We did not discussed them as they are out of the scope for this article.